
An IHUT report brings together the ratings, feedback, and other findings collected while consumers use a product at home. But even a well-run study can be difficult to use if the results are buried in too much data or presented without a clear structure.
In this guide, we cover what to include in an IHUT report, provide a section-by-section template you can use, explain which metrics are worth reporting, and share common reporting mistakes to avoid.
What Is an IHUT Report?
An IHUT report is a structured summary of the findings from an in-home usage test. A consumer product testing platform can bring together consumer feedback while using a product in their own homes, including ratings, written responses, usage feedback, and other study results.
Bringing these findings together gives the research team a clear view of what was tested, who participated, what consumers reported, and what the results show. The report can then be used to support product, packaging, or marketing decisions and provide a record of the study for future reference.
A well-structured report should make the most important findings easy to find and connect the results to the original research goals. The goal is not to include every piece of data, but to present the findings in a way that supports clear product decisions.
What Should an IHUT Report Include?
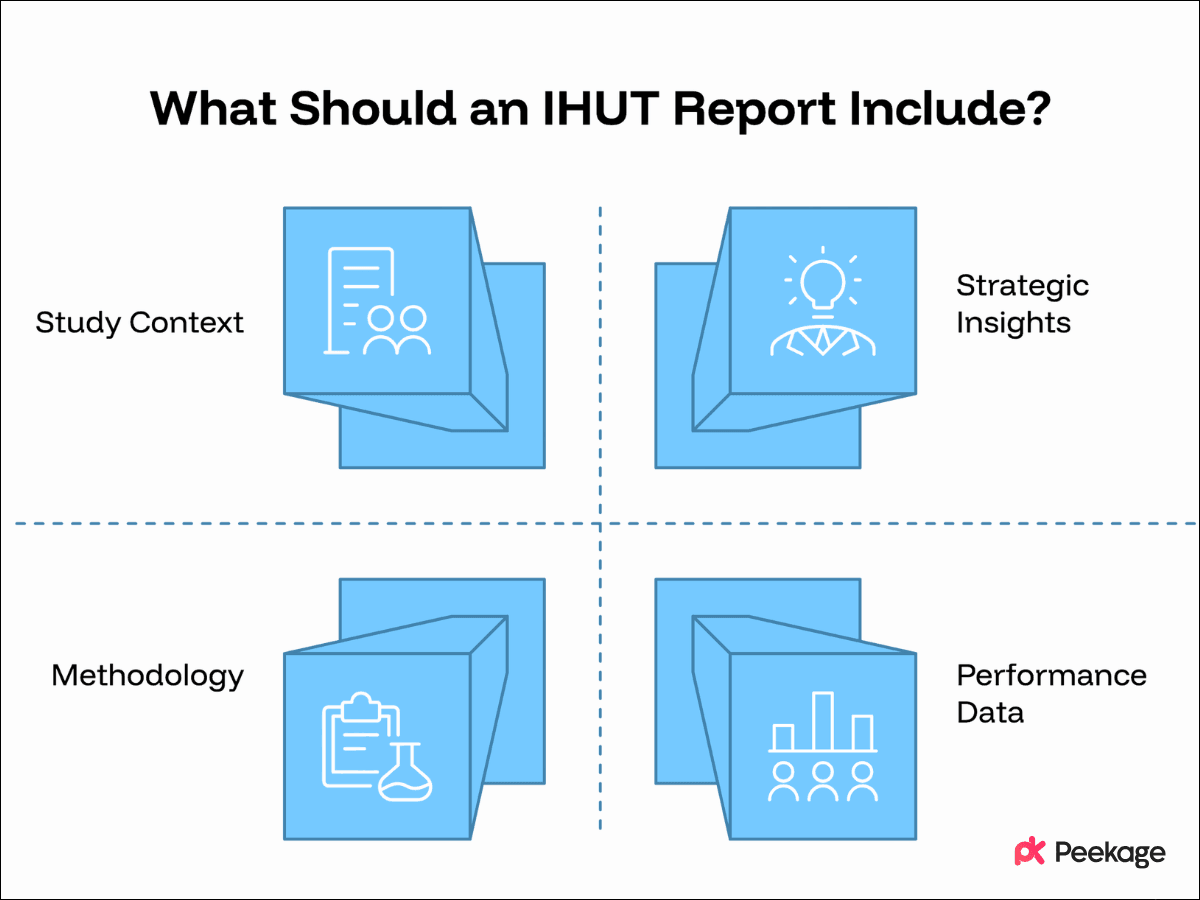
An IHUT report should bring together the main information collected through IHUT testing services, from who participated to what they thought about the product. The exact content can vary by research goal and product category, but most reports include:
- Study overview: What was tested and what the research aimed to learn
- Participant information: Who took part and how the sample was defined
- Testing details: How the product was tested and how feedback was collected
- Product results: Ratings and performance measures relevant to the study
- Consumer feedback: Open-ended responses and key themes
- Segment results: Differences between relevant consumer groups
- Conclusions: The main findings from the study
- Recommendations: Suggested product actions or areas for further testing
The next step is deciding how to organize this information so the most important findings are easy to understand and use.
What Should an IHUT Report Template Look Like?
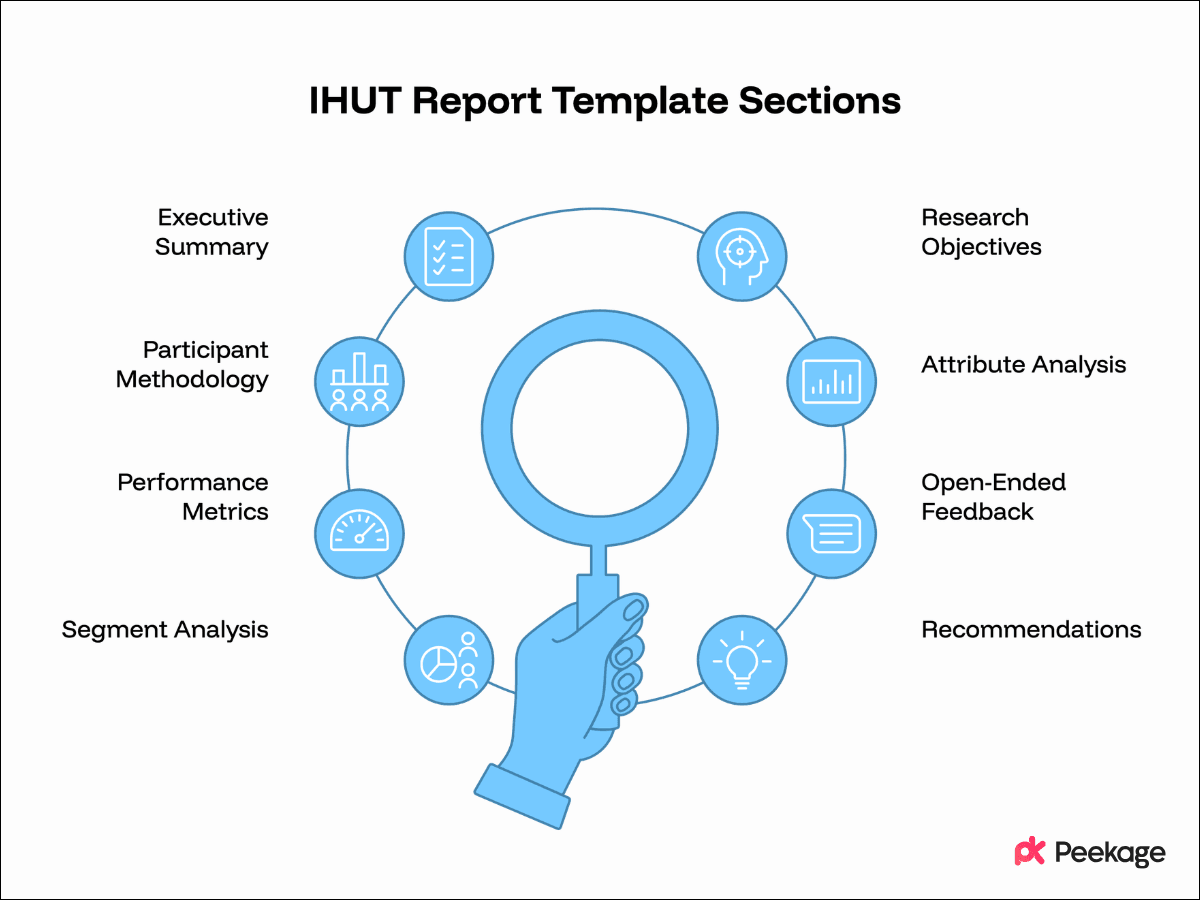
An IHUT report template should turn the core study information into a clear sequence. Start with the main findings, then provide the study context, detailed results, consumer feedback, segment analysis, and recommendations.
1. Executive Summary
The executive summary is the most important part of an IHUT report for stakeholders who need to understand the results quickly. It gives a short overview of the study, the main findings, and what those findings mean for the product. Readers should be able to understand the key results and recommendations without going through the full report.
It includes:
- Study objective: What the research aimed to learn
- Method: The IHUT design, products tested, and sample size
- Key findings: The results that matter most to the research objectives
- Main recommendations: The actions supported by the findings
Keep the summary focused on the findings that are most relevant to the research goals. For example, you could highlight that a product scored well on texture but received lower ratings for freshness, then explain the detailed results later in the report.
2. Research Objectives and Study Overview
The research objectives section in an IHUT report explains why the study was conducted and what the brand wanted to learn. This gives readers the context they need to interpret the results.
It includes:
- Research questions: What the study was designed to answer
- Products tested: The products, formulas, or variants included
- Testing method: Blind, branded, monadic, sequential monadic, comparative, or longitudinal
- Testing period: How long participants used the product
- Sample size: The number of participants and completed responses
3. Participant Profile and Methodology
The participant profile and methodology section in an IHUT report shows who took part and how the test was conducted. A simple table can make this information easier to review.
It includes:
- Participant profile: Age, location, income, household composition, and product usage
- Sample size: Number of completed responses
- Product details: Products or variants tested and testing order
- Study design: Instructions, usage requirements, and testing approach
- Analysis: Statistical or analytical methods used
Detailed methodological information can be moved to an appendix if it would make the main report harder to read.
4. Product Attribute Analysis
The product attribute analysis section in an IHUT report shows how consumers rated the product's most important characteristics. Depending on the category, these may include taste, texture, scent, freshness, appearance, ease of use, or effectiveness.
It includes:
- JAR analysis: Shows whether an attribute was too weak, too strong, or at the right level
- Key driver analysis: Shows which attributes have the strongest relationship with satisfaction or purchase intent
- Attribute comparisons: Highlights where products or variants perform differently
5. Key Product Performance Metrics
The key product performance metrics section in an IHUT report summarizes the main measures used to evaluate the product. These metrics should reflect the original research objectives rather than every measure collected during the study.
It includes:
- Overall satisfaction
- Purchase intent
- Likelihood to switch
- Sensory or performance ratings
- Net Promoter Score
- Perceived price
Use charts or tables to show important differences between products, variants, or competitors. Clearly mark statistically significant differences where relevant.
6. Open-Ended Feedback and Emotional Analysis
The open-ended feedback and emotional analysis section in an IHUT report explains the reasons behind the quantitative results through consumers' written responses. Comments can be grouped into common themes such as flavor, texture, packaging, convenience, or appearance.
It includes:
- Key themes: The topics that appear most often in consumer comments
- Sentiment: Positive, negative, or neutral responses
- Emotional response: Feelings associated with the product or experience
- Consumer quotes: Selected comments that illustrate important findings
- AI-supported analysis: Patterns and themes identified across large volumes of responses
Keep these findings connected to the original consumer comments and quantitative results so the analysis remains grounded in the study data.
7. Segment Analysis
The segment analysis section in an IHUT report shows how results differ across the consumer groups most relevant to the study. This can help identify whether the product performs differently among different audiences.
It includes:
- Age groups
- Locations
- Household types
- Product users and non-users
- Brand preferences
- Purchase channels
Focus on meaningful differences rather than including every demographic split available. This keeps the report focused on the segments that could affect product or marketing decisions.
8. Recommendations and Next Steps
The recommendations and next steps section in an IHUT report connects the study findings to clear actions. Each recommendation should be supported by a specific result from the study and linked to what the team should consider doing next.
These include:
- Maintain: Keep attributes that already perform well
- Improve: Address specific product weaknesses
- Retest: Run another IHUT after making changes
- Position: Explore consumer groups or occasions with stronger purchase intent
- Review: Reconsider products that consistently underperform
The final section should make it clear what the team can do with the findings and which results support each recommendation.
IHUT Report Template
The following IHUT report template can be adapted to different products, research goals, and consumer groups. It covers the key stages of how IHUT works, from the study setup and participant profile to product testing, consumer feedback, analysis, and recommendations.
Executive Summary
This IHUT evaluated a new sea salt potato chips product among 150 target consumers in the United States. Participants tested the product at home using a blind, monadic study design over two weeks. The research measured overall satisfaction, purchase intent, key product attributes, emotional responses, open-ended feedback, and perceived price.
The product performed strongly on taste, crispiness, and overall satisfaction. However, some consumers rated the saltiness as too high and reported that the chips felt less fresh toward the end of the testing period. Purchase intent was strong among regular potato chips buyers, while occasional category users showed lower interest in purchasing the product.
Based on the findings, the main recommendation is to review the salt level and packaging performance while maintaining the product's taste and crispiness. A second round of testing should be considered after these changes are made.
Research Objectives
The study was designed to answer the following questions:
- How satisfied are consumers with the new chips product?
- Which product attributes have the strongest relationship with overall satisfaction?
- How does the product perform on taste, texture, crispiness, freshness, and saltiness?
- Which product characteristics should be maintained or improved?
- How likely are consumers to purchase the product?
- What price do consumers consider reasonable for the product?
- Which consumer segments show the strongest purchase intent?
- What do consumers like and dislike about the product?
- What improvements would consumers make to the product?
Study Overview and Methodology
The study evaluated a new sea salt potato chips product among 150 consumers who regularly purchase potato chips.
Participants completed a blind, monadic IHUT. They received the product without seeing the brand name or other brand identifiers. Each participant used the product at home over a two-week testing period and completed surveys after initial use and at the end of the study.
The study measured overall satisfaction, purchase intent, product attributes, perceived price, emotional response, and open-ended feedback. JAR analysis was used to assess saltiness and crispiness, while key driver analysis was used to identify the attributes most closely related to overall satisfaction.
Participant Profile
The study included 150 consumers aged 18 to 54 who had purchased potato chips at least twice during the previous month.
The sample included consumers from several US regions and a mix of household types and income levels. Participants included both frequent and occasional potato chips buyers.
The sample was screened based on category usage, recent purchase behavior, and willingness to test a new chips product at home.
Just About Right Attribute Results
The JAR analysis showed that most consumers considered the product's crispiness to be at the right level. Saltiness produced a more mixed response, with a higher proportion of consumers describing the product as too salty.
| Attribute | Too Low | Just Right | Too High |
|---|---|---|---|
| Crispiness | 6% | 78% | 16% |
| Saltiness | 5% | 64% | 31% |
| Flavor intensity | 8% | 75% | 17% |
The results suggest that crispiness is a strength that should be maintained, while saltiness may require further review.
Key driver analysis showed that taste and crispiness had the strongest relationship with overall satisfaction. Saltiness also influenced satisfaction, particularly among consumers who rated the product below the overall satisfaction benchmark.
Key Product Performance Results
The product received strong overall satisfaction scores, with 82% of consumers rating their experience positively. Purchase intent was lower at 68%, suggesting that liking the product did not translate directly into an intention to buy.
| Metric | Result |
|---|---|
| Overall satisfaction | 82% |
| Purchase intent | 68% |
| Likelihood to recommend | 71% |
| Likelihood to switch | 54% |
| Perceived value | 73% |
| NPS | +24 |
Taste and crispiness received the highest attribute ratings. Freshness received a lower score, with some consumers reporting that the product felt less fresh toward the end of the testing period.
The difference between overall satisfaction and purchase intent suggests that factors beyond the product experience may influence whether consumers would buy the product.
Consumer Feedback and Emotional Analysis
Open-ended responses showed that taste, crispiness, and the overall eating experience were the most frequently mentioned positive themes.
Consumers often described the chips as flavorful, crunchy, and enjoyable. Some participants also mentioned that the product felt easy to snack on and suitable for casual occasions.
The most common negative feedback focused on saltiness and freshness. Several consumers felt that the chips were too salty, while others reported that the product did not feel as fresh after repeated use.
Sentiment analysis showed that most responses were positive, with enjoyment and satisfaction among the most common emotional reactions. Negative responses were more often associated with excessive saltiness and freshness.
One consumer described the product as “very crunchy and flavorful but a little too salty.” Another noted that the chips were “great when first opened, but less fresh later in the test.”
AI-supported analysis identified the same recurring themes across the open-ended responses and helped connect them with the quantitative attribute results.
Purchase Intent and Segment Analysis
Purchase intent was strongest among frequent potato chips buyers. Consumers who purchased chips several times per month were more likely to say they would buy the product than occasional category users.
Younger consumers also showed somewhat higher purchase intent, while differences by household income were less pronounced.
The strongest segment results were:
| Consumer Segment | Purchase Intent |
|---|---|
| Frequent category users | 78% |
| Occasional category users | 55% |
| Ages 18 to 34 | 74% |
| Ages 35 to 54 | 63% |
The results suggest that frequent category users may be an important target audience for the product. Further research could explore whether the product's taste and texture are particularly relevant to this group.
Price Perception
Consumers perceived the product as having an average value of $4.49 per bag. The acceptable price range was $3.99 to $4.99.
The intended retail price was $4.49, which matched the average perceived value reported by participants.
| Price Measure | Result |
|---|---|
| Average perceived price | $4.49 |
| Lower acceptable price | $3.99 |
| Upper acceptable price | $4.99 |
| Intended retail price | $4.49 |
Perceived value was generally positive, although some consumers who rated the product as too salty also reported lower value perceptions. This suggests that improving the product experience could support the perceived value of the product.
Conclusions and Recommendations
The IHUT results show that the new chips product has strong potential based on its taste, crispiness, and overall consumer satisfaction. The main areas for improvement are saltiness and freshness over the testing period.
The recommended actions are:
- Maintain: Keep the current taste and crispiness, which received strong consumer responses.
- Improve: Review the salt level and investigate the freshness concerns reported during repeated use.
- Retest: Conduct another IHUT after making product or packaging changes.
- Target: Consider frequent potato chips buyers as a priority consumer group for further research.
- Price: Maintain the planned $4.49 price point if product improvements do not materially change perceived value.
The next step is to test the revised product with consumers and determine whether the changes improve the attributes identified in this study without reducing the product characteristics that consumers already value.
How to Present IHUT Results in a Report
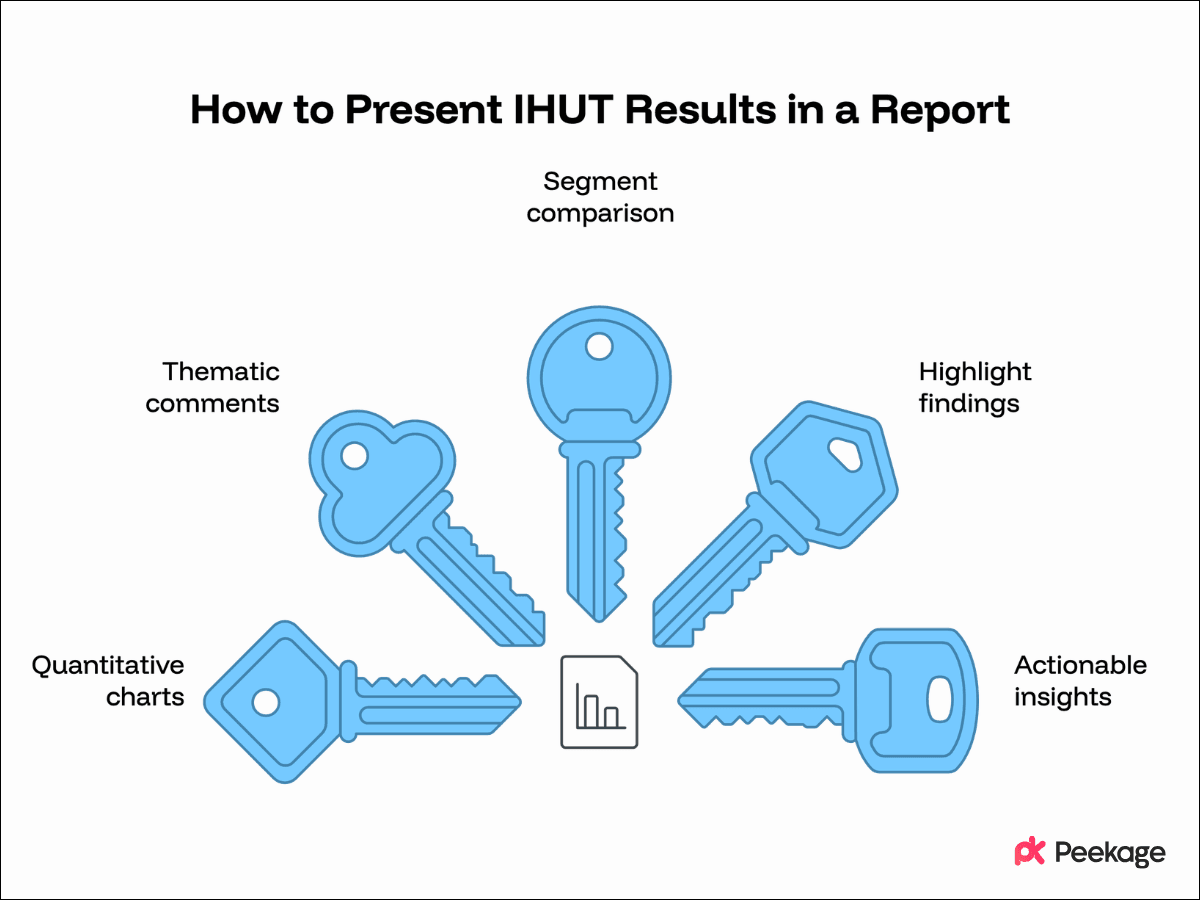
Once the report structure is in place, the next step is to present the findings in a way that makes them easy to understand. The goal is to help stakeholders quickly see what consumers liked, where the product needs improvement, and what the results suggest doing next.
- Use charts for quantitative results: Use bar charts to compare product attributes and stacked bars to show rating distributions. Keep each chart focused on one main finding and add a short explanation when the result needs context.
- Group consumer comments by theme: Organize open-ended feedback into themes such as taste, texture, packaging, convenience, or effectiveness. Show how often each theme appeared and include selected consumer comments when they help explain the result.
- Compare relevant consumer segments: Look beyond topline results when the study includes meaningful differences between groups. Compare measures such as satisfaction, purchase intent, or product attributes across relevant consumer profiles.
- Highlight important findings: Make findings that relate directly to the research objectives easy to find. Short summaries, clear headings, and callout boxes can help readers identify the results that may affect product decisions.
- Connect findings to actions: Explain what an important result means for the product or next stage of research. For example, a lower ease of use rating could support a recommendation to review the packaging or instructions before another round of testing.
It’s also useful to monitor responses while the IHUT is still in progress. Reviewing incoming data can help identify missing responses, unusual patterns, or other issues while there is still time to address them. This can help protect the quality of the final report and prevent avoidable problems from going unnoticed until fieldwork has ended.
What Metrics Should Be Included in an IHUT Report?
The metrics you include should match the product and research objectives. Most IHUT reports focus on the following:
- Purchase intent: Shows how likely consumers are to buy the product, often reported as a Top 2 Box score.
- Overall satisfaction and liking: Measures the overall consumer response and can be compared with a competitor, current product, or previous version.
- Product attribute ratings: Measures specific characteristics such as taste, texture, scent, effectiveness, or ease of use.
- JAR analysis: Shows whether important attributes are too low, too high, or at the level consumers prefer.
- Repeat purchase and usage intent: Shows whether positive first-use experiences are likely to translate into continued use or future purchases.
- Perceived value and price: Helps assess whether consumers think the product offers enough value at the expected or intended price.
- NPS: Measures likelihood to recommend and can provide an additional view of consumer advocacy alongside other product measures.
The final selection should reflect what the IHUT was designed to learn rather than include every metric collected.
Common IHUT Reporting Mistakes to Avoid
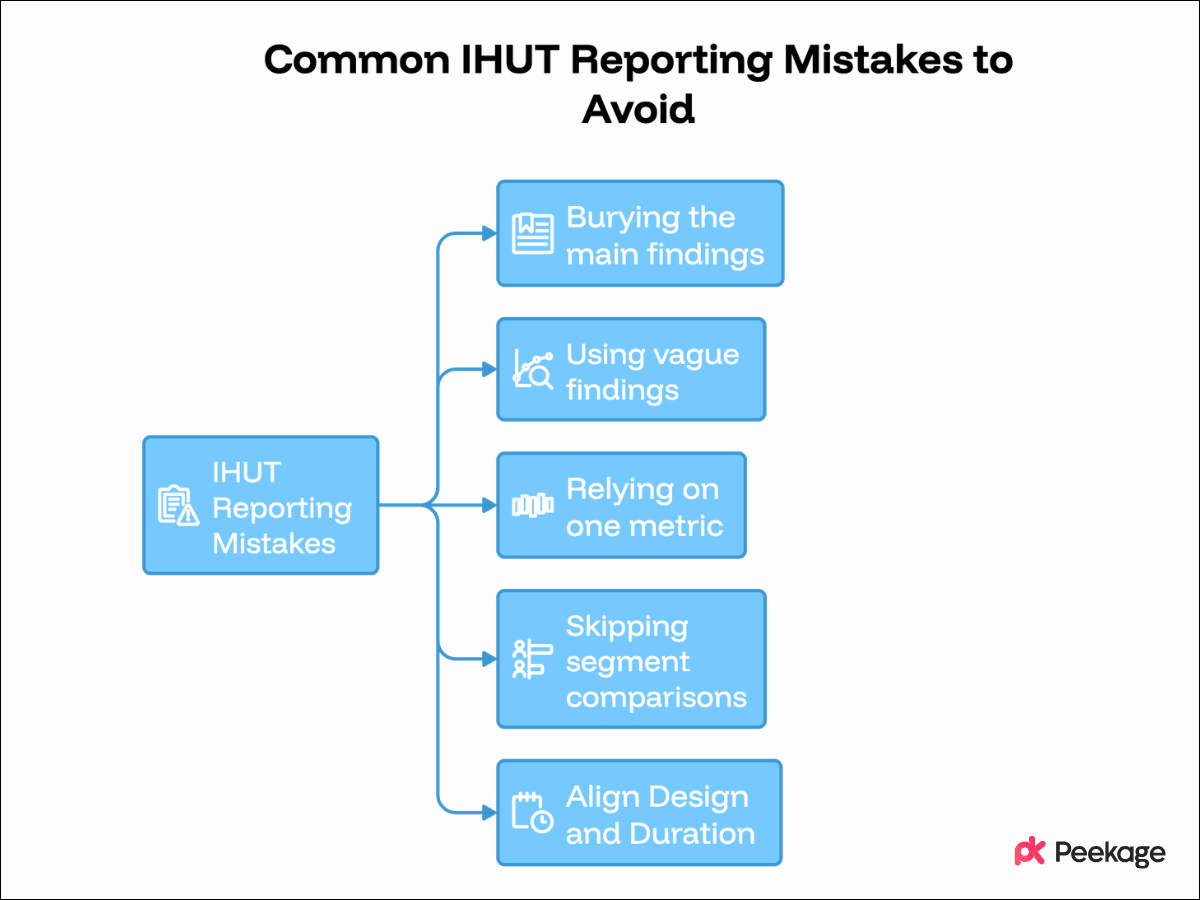
Even a well-conducted IHUT can be difficult to use when the findings are poorly reported. Avoid these common mistakes:
- Burying the main findings: Put the most important results near the beginning of the report so stakeholders can see them without going through every table and chart.
- Using vague findings: A statement such as “62% liked the product” provides limited context. Explain which product attribute, usage experience, or other factor contributed to the result.
- Relying on one metric: No single measure can capture the full consumer response. Look at satisfaction, purchase intent, product attributes, and other relevant measures together.
- Skipping segment comparisons: Topline results can hide differences between consumer groups. Compare relevant segments when the study sample and research objectives support it.
- Using the wrong study design or duration: The testing method and field period should match the product and research goals. A short use cycle may require a different approach from a product that consumers use over a longer period. If the study duration does not fully reflect normal usage, note this as a limitation in the report.
How Peekage Provides Brands with Actionable IHUT Reports
Peekage supports the full IHUT process, from recruiting participants for IHUT and collecting consumer feedback to analyzing results and creating clear, visual reports.
The reports bring product performance, consumer feedback, and commercial metrics together. Instead of leaving teams with raw survey responses, our platform helps connect the findings to specific product and business decisions.
- Clear study overview and key insights: Reports bring together the research objective, participant profile, testing methodology, and main findings. They highlight key product strengths, performance gaps, competitor differences, pricing insights, and potential next steps.
- Product attribute and key driver analysis: JAR analysis shows whether consumers consider attributes such as flavor, freshness, texture, scent, or effectiveness too low, too high, or about right. Key driver analysis helps identify which attributes have the strongest relationship with satisfaction or purchase intent.
- Side-by-side performance comparisons: Brands can compare products, variants, or competitors across measures such as satisfaction, purchase intent, likelihood to switch, NPS, product performance, and perceived value or price. Charts and tables make important differences easier to identify.
- Consumer feedback and AI Analytics: Peekage organizes open-ended responses into recurring themes. Sentiment and emotion analysis can add context to the quantitative results. AI Analytics can process IHUT testing data, identify patterns and themes, and suggest areas for potential product improvement.
- In-depth segment analysis: Brands can use filters, Data Explorer, and crosstabs to examine results across relevant consumer groups. These can include age, location, household characteristics, usage frequency, brand preference, and purchasing behavior. This helps identify where responses differ between segments.
- Pricing and commercial insights: Perceived price can be compared with intended retail pricing and competitor perceptions. It can also be viewed alongside measures such as purchase intent. This helps teams understand how consumers perceive the product's value.
- Recommendations connected to results: The report brings the findings together to support specific actions. These may include maintaining strong attributes, improving weak areas, reformulating and retesting, adjusting positioning or pricing, or exploring specific consumer segments.
By bringing quantitative results, consumer feedback, AI Analytics, pricing insights, and segment-level findings into one report, Peekage helps product, insights, and marketing teams move from consumer responses to their next decision.
Talk to the Peekage team to see how Peekage can support your next IHUT.