
Key Driver Analysis for CPG Products: Use Cases and Examples
Most CPG teams sit on mountains of survey data and sales numbers. But knowing what happened is very different from knowing why it happened. For example, your satisfaction scores dropped 4 points last quarter: Was it the new formula? The price increase? The redesigned label? Without a clear answer, you can’t make the right changes.
Key driver analysis is the statistical method that answers that question. It identifies which product attributes actually influence consumer behavior, like purchase intent or loyalty scores.
In this guide, we'll walk through what key driver analysis is, how to run one step by step, and the real benefits for CPG brands. We've also included real examples from published research to make the methodology concrete.
What Is Key Driver Analysis for CPG Products and How to Conduct It?
Key Driver Analysis (KDA) is a method we use to find out what truly influences your customers’ decisions. If you want to increase purchase intent, NPS, satisfaction, or repeat purchase, we use KDA to see which product features actually drive those results.
These features are called drivers. They can include taste, price, packaging, brand trust, scent, or nutritional claims.
When you ask customers what matters most, they often say things like sustainability or ingredient quality. But when we analyze their ratings using statistics, the real driver is often taste or price. This is the difference between what customers say matters and what actually influences their behavior. KDA helps us uncover what truly moves your results.
How to Conduct a Key Driver Analysis
Key Driver Analysis can be done in five clear steps. The process is structured, and each step is important.
1. Define the objective and outcome.
Start by deciding what you want to understand or improve. This is the dependent variable. It could be purchase intent, NPS, satisfaction, or repeat purchase. The chosen outcome guides the entire analysis.
2. Identify possible drivers.
List the product attributes that may influence the outcome. Be thorough. For a beverage, this could include taste, sweetness, carbonation, packaging, price, availability, and brand perception.
3. Conduct a scaled survey.
Ask respondents to rate each attribute using a structured scale, often a 5 point scale. They should also rate the overall outcome, such as satisfaction or likelihood to buy. Do not ask directly which attribute is most important. The goal is to measure ratings and let the statistical analysis determine importance.
4. Run statistical analysis.
Use regression analysis to measure how strongly each attribute affects the outcome. Standard regression is common. More advanced methods, such as Random Forest or Hierarchical Bayes regression, can improve prediction accuracy by analyzing patterns across many models or individual respondents.
5. Interpret the results using an importance and performance matrix.
Plot the findings on a quadrant chart.
- Attributes with high importance and low performance are top priorities for improvement.
- Attributes with high importance and high performance should be maintained.
- Attributes with low importance but high performance may indicate over investment.
What Are the Benefits of Key Driver Analysis for CPG Products?
You Know Where to Focus Your Budget
KDA shows which two or three attributes drive most of your results. Often, a small number of features explain the majority of the outcome. Instead of trying to improve everything, you focus on what truly moves purchase intent or NPS. This turns strategy into a clear investment decision, not a guessing game.
You Uncover What Customers Do Not Openly Say
Customers often say they care about one thing but act differently. For example, someone may claim sustainability matters most, but still choose to pay less for a product. KDA measures what actually drives behavior, not just what people say in a survey.
You Can Estimate Impact Before Making Changes
KDA allows you to model outcomes. If you improve a specific attribute, you can estimate how satisfaction or purchase intent may change. This helps you prioritize product updates based on expected impact, not assumptions.
You Strengthen Your Positioning
When you understand what truly drives preference, your brand positioning becomes clearer. You stop guessing at what makes your brand different. Instead, you build your positioning around real data.
You Make Smarter Concept Decisions
During concept testing, KDA shows which features increase interest and which hurt it. This helps you refine concepts before investing in production.
You Adjust Strategy by Audience
Drivers are not always the same for every target segment. One group may care more about price, while another focuses on sustainability or ingredients. Segment-level analysis lets you adjust product positioning and packaging by audience, not assumption.
Overall, KDA helps you replace assumptions with evidence and make focused, confident decisions.
How to Build a Key Driver Analysis: Step-by-Step Process from Defining the Objectives to Survey Design and Launch with Peekage
In the past, running a Key Driver Analysis required data scientists, long timelines, and a large budget. With the concept testing services of Peekage, the full process happens in one platform. You can manage recruitment, product sampling, survey design, data collection, and analysis in one place.
The platform includes access to over 5 million consumers, segmented by more than 200 attributes. This allows you to match your study to the exact type of buyer you want to understand.
Step 1: Define Your Research Objective
Start by clarifying what outcome you want to understand and improve. Key driver analysis is used to identify which factors have the strongest impact on a specific outcome, like overall satisfaction, purchase intent, or likelihood to recommend. Are you trying to understand what drives customer satisfaction? What influences repeat purchase? The objective determines both the main metric and the factors you’ll measure.
Step 2: Identify the Attributes to Test
Build a list of the features, perceptions, or attributes you believe may influence your main outcome. These could include product quality, price perception, packaging, ease of use, brand trust, or customer support. Keep the list comprehensive but focused, and make sure each attribute is clearly defined and measurable so respondents can evaluate them consistently.
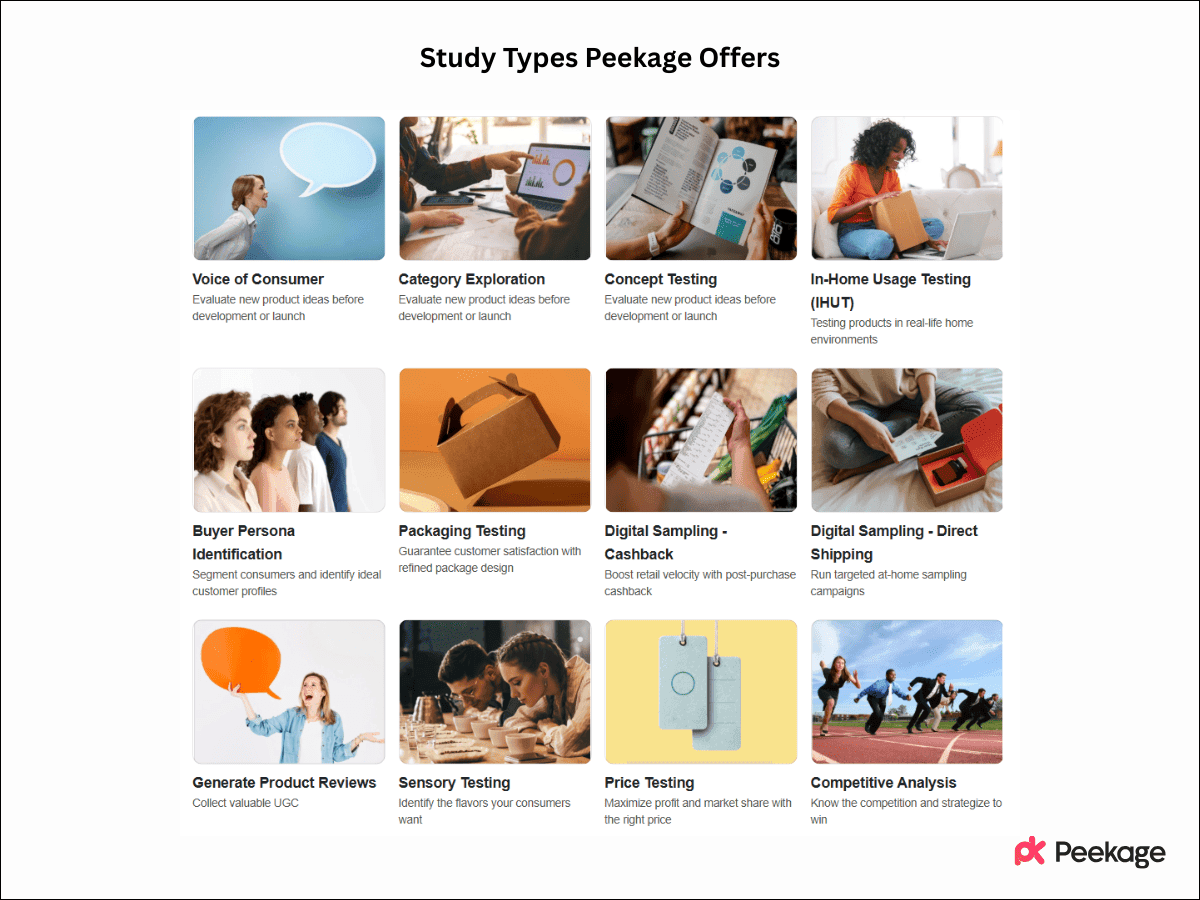
Step 3: Pick Your Study Type in Peekage
Choose the study type that fits your objective, then apply key driver analysis within that framework. The study type sets the context, while key driver analysis determines how the relationships between variables are analyzed. The way you frame your questions matters, as it directly affects how respondents interpret and rate each attribute.
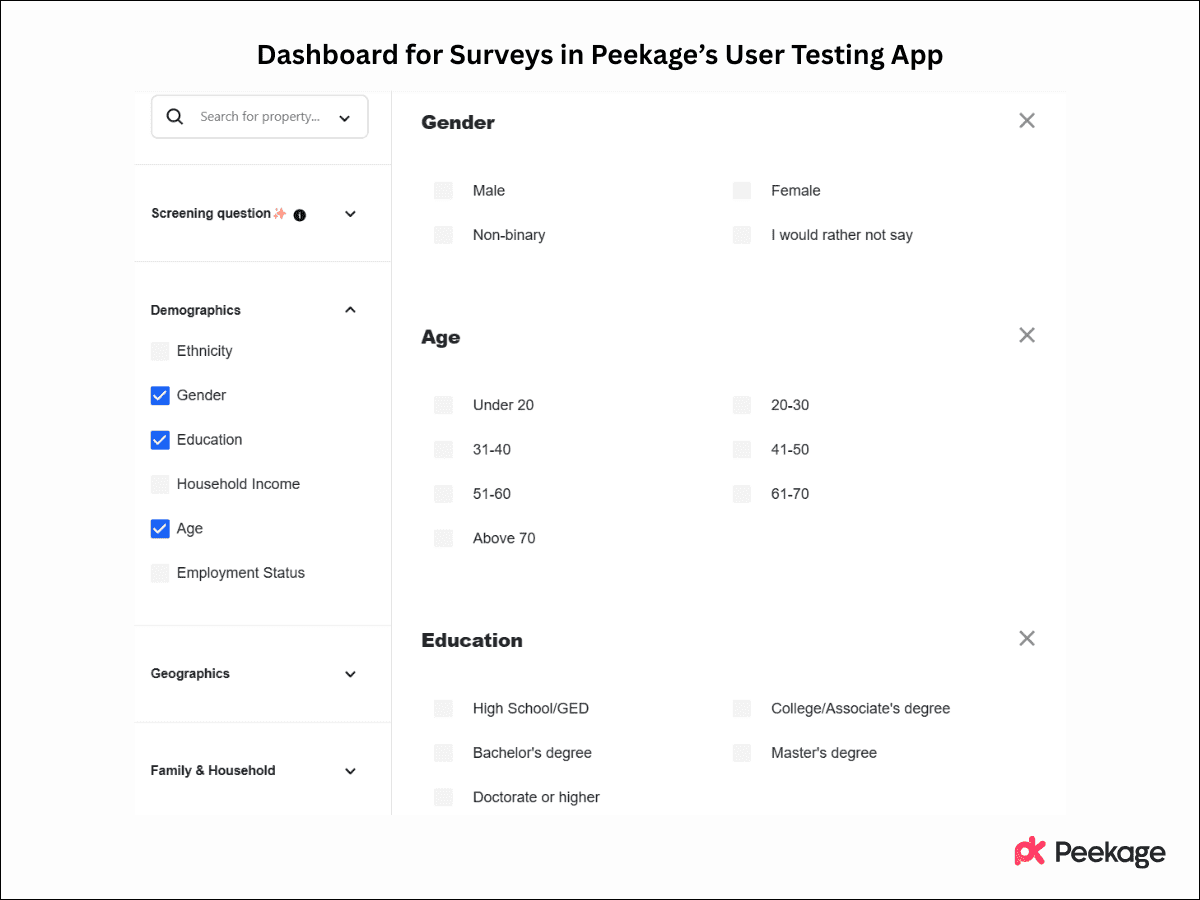
Step 4: Build Your Panel Using 200+ Attributes
Use Peekage to target the right audience for your study. Define demographic, behavioral, and geographic criteria to ensure responses come from relevant participants. Sample size is important here, since key driver analysis relies on statistical relationships, you typically want a robust sample to produce stable and reliable results. Peekage’s panel includes over 200 targeting attributes, and pre-screening allows you to further refine your audience if needed.
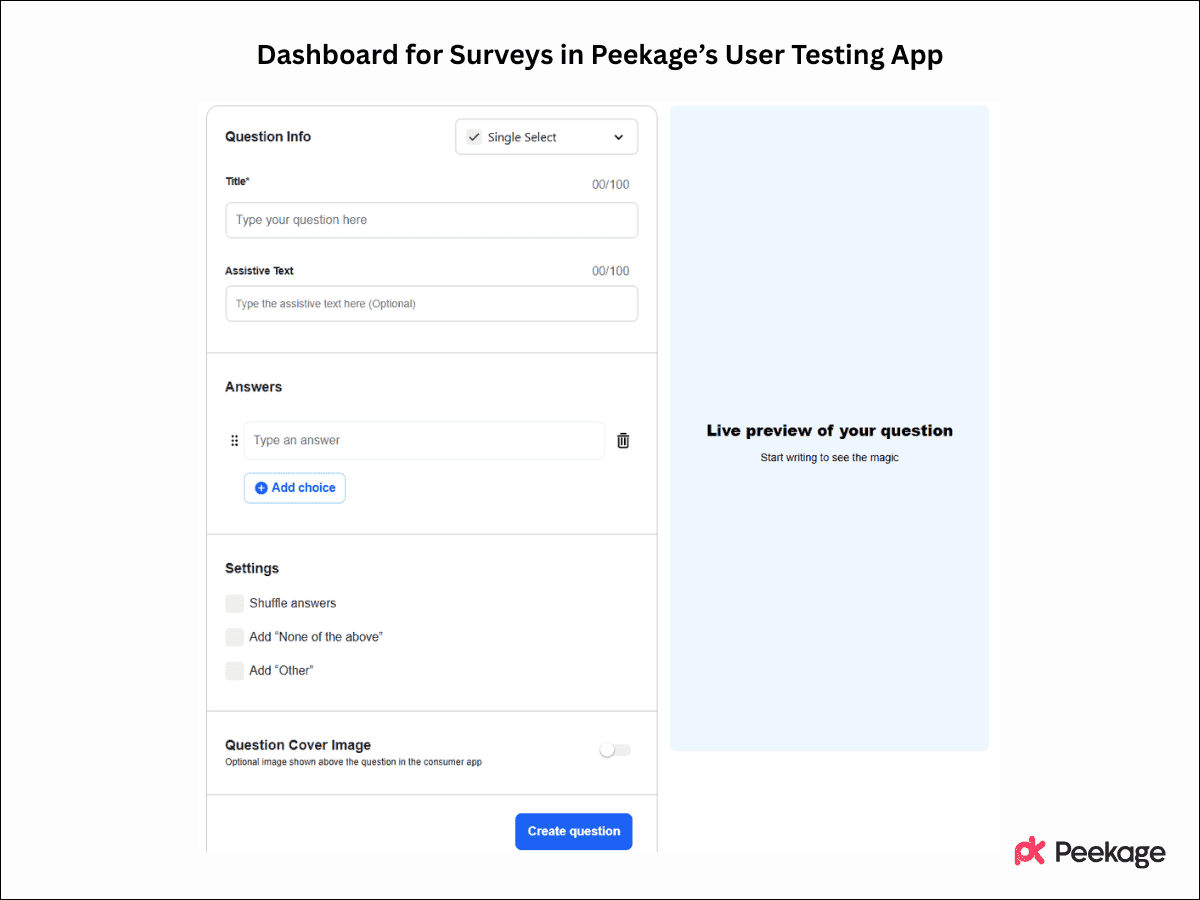
Step 5: Design Your Survey or Review the One Built by AI
Create a survey that captures both your main outcome metric and the attributes you want to test. This usually involves rating-scale questions. Add a few follow-up questions for context, such as demographics or usage behavior, but keep the survey concise to maintain response quality. You can start from Peekage templates or use its AI-generated survey, just make sure to review everything to ensure alignment with your objectives and variables.
Step 6: Send for Peekage Review and Launch Your Campaign
Before launching, submit your survey for Peekage review. The team checks the structure, ensures the variables are set up correctly, and confirms the study is ready to produce meaningful analysis. This review typically takes 1–2 days. Once approved, you can launch your campaign. Peekage’s execution AI manages recruitment and data collection, while the quality agent filters out poor responses. You can monitor progress through the live dashboard, with most studies completed within 2–5 days.
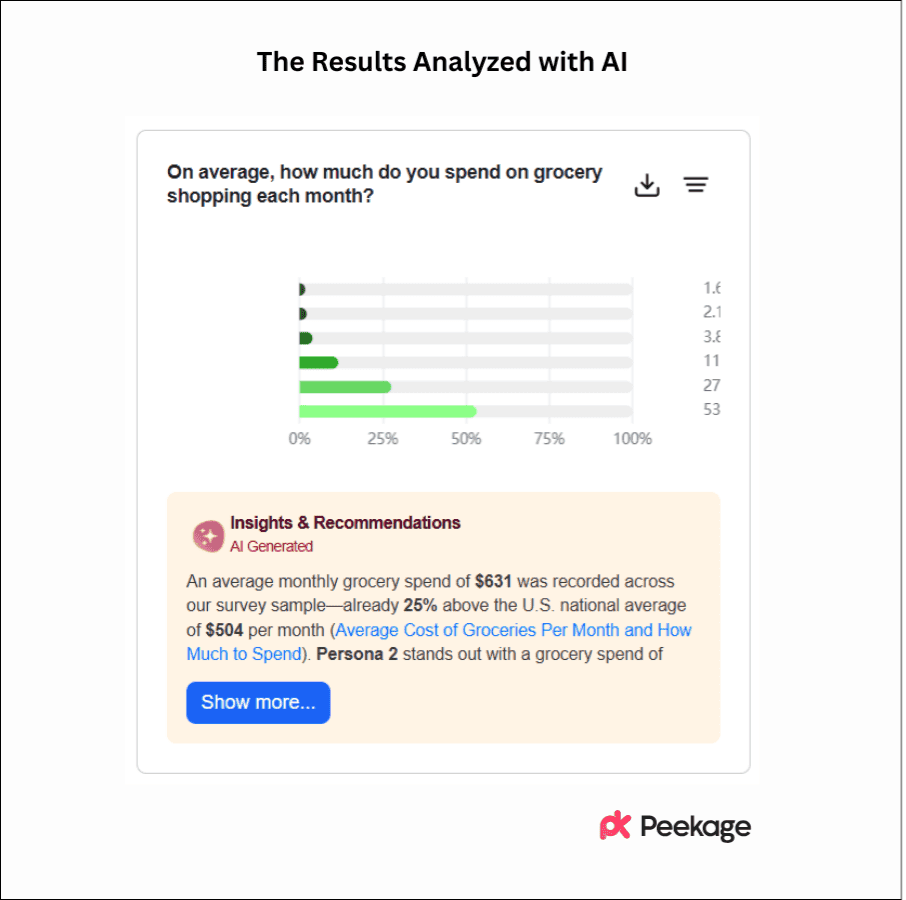
Step 7: Analyze Results and Take Action
Key driver analysis results show which attributes have the strongest impact on your chosen outcome, not just how they are rated, but how much they actually influence behavior or perception. Peekage presents this through driver scores, importance rankings, and visualizations like impact-performance grids. The AI assistant highlights the most important drivers, areas for improvement, and opportunities to prioritize.
The goal is to focus your efforts on what truly moves the needle, so you can make smarter product, marketing, or experience decisions.
Key Driver Analysis Examples from Our Successful Campaigns
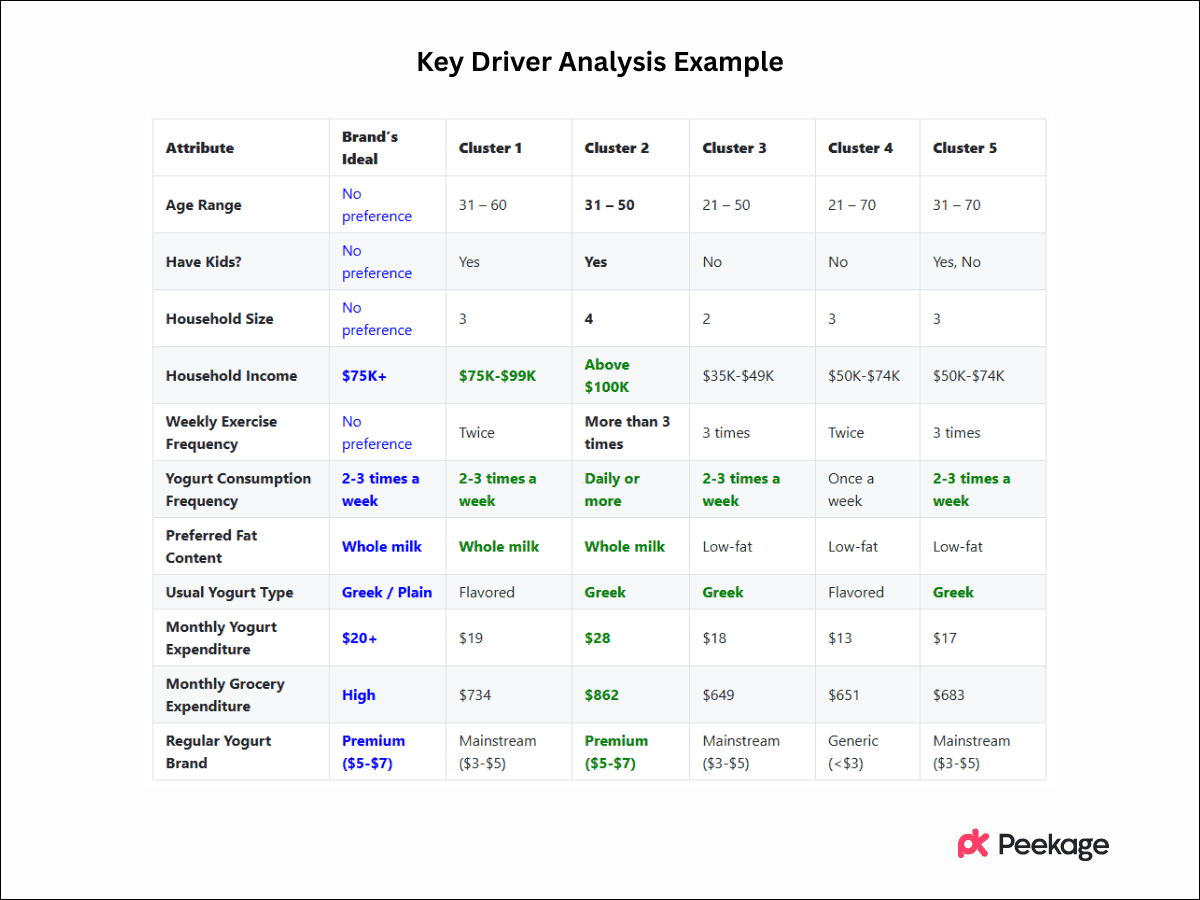
Our client, a premium yogurt brand, wanted to better understand who their core buyer is and what drives their purchasing decisions in order to develop more targeted, data-driven marketing strategies.
To support this goal, we conducted an online consumer research study with more than 1,600 regular yogurt buyers. The survey collected over 40 behavioral, attitudinal, and demographic variables, and the data was analyzed using a two-stage clustering method to identify distinct consumer segments and validate them statistically.
The analysis revealed five meaningful shopper segments, each with different behaviors and motivations. Among these, one segment emerged as the strongest match for the client’s premium, health-focused positioning, representing consumers who purchase yogurt frequently, prefer whole-milk Greek yogurt, and are willing to spend more on premium products.
Key Findings
- A high-value target segment was identified that aligns closely with the client’s brand values and presents the greatest growth potential.
- Premium yogurt buyers tend to be highly engaged consumers, purchasing yogurt frequently and spending more on both yogurt and groceries overall.
- Additional consumer segments represent secondary opportunities, where tailored messaging or future product innovation could expand the brand’s reach.
Wrapping Up
In CPG, guessing what drives consumer decisions is costly. Key driver analysis replaces assumptions with clear data. It helps whether you are improving an existing product, testing a prototype, or repositioning against competitors.
Peekage makes this process simple and accessible. You get access to a panel of over 5 million consumers, built in survey design, AI powered analysis, and clear reporting in one platform. You do not need a data science team, and you do not have to wait months for results.
If you want to understand what is truly driving purchase decisions for your brand, you can speak with a Peekage expert and run your first key driver analysis within days.