
Have you ever launched a product that seemed promising, but the results did not match your expectations? Or tried to enter a new market and struggled to understand what really drives your audience? In many cases, the issue comes down to one thing: not having clear, actionable consumer insights.
Today, understanding your consumers is more important than ever. Yet many brands still rely on assumptions or surface-level data when building products or planning campaigns. Because of this, products miss the mark, messaging falls flat and brands struggle to grow.
This is where usage and attitude services come in. They help you understand how people use your product and how they feel about it. When you know both, you can make better decisions and build something people actually want.
In this guide, we will walk you through what U&A studies are, how to run them, and how they can support your brand strategy.
What Is a Usage and Attitude (U&A) Study?
A usage and attitude study, or U&A study, is a type of market research that helps you understand how people use products and how they feel about them. Some also call it a baseline study because it gives you a clear starting point.
At its core, it answers simple questions:
- What do people buy?
- How do they buy it?
- When and where do they use it?
- And most importantly, why do they make those choices?
What makes a U&A study different from a typical survey is that it looks at 3 things at the same time.
- First, it looks at the category. This means how often people buy or use a product, when they use it, and what might stop them from buying.
- Second, it looks at the brand. This includes how well people know your brand, what they think about it, and how it compares to others.
- Third, it looks at the consumer. This helps you understand who your buyers are, what drives them, and what frustrates them.
You might also hear it called an "Attitude and Usage study" or "A&U study". In the end, it all means the same thing.
One important thing to know is that a U&A study doesn't only focus on your current customers. It also includes people who don't use your product and those who choose competitors. This gives you a much fuller picture than a typical customer survey.
Key Components of a Usage and Attitude Study
To get useful insights, the usage and attitude study should cover several important areas that together give a complete view of consumer behavior.
1. Usage Patterns
This part of the study looks at how consumers use a product or interact with a category. It focuses on things like how often they use it, when they use it, and in what situations it becomes part of their routine.
For CPG brands, these insights can reveal whether a product is used daily, occasionally, or only for specific needs. It can also show which product formats, pack sizes, or flavors consumers prefer most.
Understanding usage patterns helps brands improve products, packaging, pricing, and distribution strategies.
2. Attitudes and Perceptions
Usage data explains consumer actions, but attitudes explain the reasons behind those actions. This section explores how people feel about a brand, its products, and competing options in the market.
Consumers may see a brand as affordable, premium, healthy, convenient, trustworthy, or outdated. These perceptions often influence purchase decisions just as much as product quality.
By understanding consumer attitudes, brands can improve messaging, strengthen positioning, and address concerns that may prevent people from buying.
3. Purchase Behavior
Purchase behavior focuses on how consumers make buying decisions. It examines what motivates people to purchase, where they shop, and what factors influence their final choice.
For example, a U&A study may uncover whether consumers are influenced more by price, promotions, ingredients, packaging, reviews, or brand reputation.
This information helps CPG brands improve customer acquisition strategies, retail placement, e-commerce performance, and promotional campaigns.
5. Consumer Segmentation
Not all consumers think or behave the same way. That is why segmentation is an important part of any usage and attitude study.
Segmentation groups consumers based on factors such as age, income, lifestyle, habits, interests, or purchasing behavior. This helps brands identify which audiences are most valuable and how different groups respond to products or marketing messages.
For CPG brands, segmentation makes it easier to create targeted campaigns, develop relevant products, and personalize communication for different customer groups.
When to Perform a Usage And Attitude Study
A usage and attitude study fits best when your brand faces one of these situations:
- You're operating on assumptions about what consumers want, and you don't have recent data to confirm or deny them.
- You suspect there are untapped consumption occasions, like a snacking window or a seasonal use case, that your product could fill.
- You're about to develop a new product line or extend into a new category, and you want to validate the direction before committing a budget.
- A strategic planning cycle is coming up, and you want a clear picture of how you stack up against competitors.
- Consumer behavior has shifted, whether from economic changes, demographic trends, or cultural shifts, and your old research no longer reflects reality.
- A product launch is on the horizon, and you want to pressure-test your positioning, messaging, or target persona before going to market.
If any of those sound familiar, a U&A study is worth the investment.
When NOT to Perform a Usage And Attitude Study
Not every question needs a full usage and attitude study. In some cases, a simpler approach will give you faster and more useful answers.
You may want to skip a U&A study when:
- You have a very specific question, like choosing between two package designs.
- Your objectives are not clearly defined.
- You are trying to cover too many topics at once.
- Your team does not have the time or resources to analyze and act on the results.
In these situations, a smaller and more focused study is often the better choice, such as a quick concept test, a package test, or a short pulse survey. These are faster, easier to manage, and more likely to lead to clear decisions.
What Are the Benefits of U&A Study for CPG Brands?
CPG brands operate in fast-moving categories where consumer preferences change quickly and competition is high. That's exactly where usage and attitude research becomes valuable.
Create Customer-Centric Products
A usage and attitude study helps you understand what people really want, not what you assume they want. That gap is where many products fail. According to Mintel, 95% of the roughly 30,000 new products launched each year fail.
When you use real consumer insights early, you are more likely to build products that fit into people's lives and solve real needs. It also helps you create stronger connections, which leads to higher loyalty over time.
Create Effective Marketing And Advertising Campaigns
Usage and attitude research helps you group your audience based on how they behave and what they believe. This makes it easier to create messages that feel relevant instead of generic.
For example, you can learn that people use your product as part of an evening routine. That one insight can shape your messaging, timing, and even the channels you choose.
Measure Customer Loyalty And Satisfaction
A usage and attitude study goes beyond simple metrics. It shows how people feel about your brand, how loyal they are, and what may cause them to switch. Capital One Shopping reports that 56% of consumers claim more loyalty to brands that "get" them.
Instead of looking at one moment in time, you get a full picture of the customer experience. If you run the study regularly, you can also track how loyalty changes over time.
Identify Potential Areas for Improvement
U&A research helps uncover problems that are easy to miss. This could be confusion about your message, frustration with packaging, or moments where your product does not fit into people's routines.
These insights are often hard to capture in basic surveys, but they can make a big difference when it comes to improving your product and overall experience.
What Are the Challenges in Usage and Attitude Research and How to Overcome Them?
Usage and attitude research is insightful, but it comes with a few common challenges. The good news is that each one can be managed with the right approach.
People Say What Sounds Right, Not What Is True
Sometimes people give answers they think you want to hear instead of being fully honest. For example, they can say they use your product more often than they actually do.
What to do: Use blind studies where the brand is hidden so people respond more objectively. You can also offer neutral incentives like gift cards or early product access to encourage honest answers.
Customer Opinions Change Quickly
What people think today may not be the same in a few months. If you only run a study once a year, your data can become outdated.
What to do: Treat research as an ongoing process. Run smaller, more frequent studies, such as monthly surveys or post-purchase feedback, to stay up to date.
Too Much Data, Not Enough Focus
It is easy to ask too many questions and end up with more data than you can use. This makes it harder to find clear insights.
What to do: Start with 3 to 5 key questions you want to answer. Build your survey around them so your results stay focused and useful.
Not Enough Responses
Another common issue is that not enough people respond. If too few people respond, your results may not reflect your real audience.
What to do: Keep surveys short and easy to complete, especially on mobile. Reach out soon after a purchase or interaction, and offer small incentives to improve participation.
Examples of Usage And Attitude Survey Questions
Strong U&A surveys move from broad awareness down to specific behavioral and attitudinal details. Here are sample questions across four dimensions.
Product Awareness Questions
- "Which brands in [category] can you name off the top of your head?"
- "Which of the following brands have you heard of, tried, or considered?"
- "Where did you first learn about [Brand]?"
Product Usage Questions
- "How often do you use [Product] in a typical week or month?"
- "In what situations do you typically use this product?"
- "Compared to 6 months ago, do you use [Brand] more, less, or about the same?"
Product Satisfaction Questions
- "On a scale of 1 to 10, how satisfied are you with [Brand X]?"
- "How would you rate [Brand X] on taste, quality, and value for money?"
- "How likely are you to recommend [Brand] to a friend or colleague?"
Product Purchasing Habits Questions
- "Where do you most often buy [Category]: online or in-store?"
- "What factors most influence your choice of [Category]?"
- "Approximately how much do you spend on [Category] per month?"
How to Conduct Usage and Attitude Studies with Peekage
Peekage is a consumer testing platform built for CPG brands. It handles the entire usage and attitude study process, from recruiting respondents to delivering finished reports.
Step 1: Define Your Research Objectives
Be clear about what you want to learn from your usage and attitude study and how it connects to your broader research goals. A usage and attitude study helps you understand how people currently use products or services, what they think and feel about them, their habits, preferences, pain points, and purchasing behaviors. Are you exploring consumer routines? Measuring brand perception? Understanding motivations and unmet needs? Identifying opportunities for improvement? Your objectives will shape the questions you ask, the audience you target, and the insights you gather.
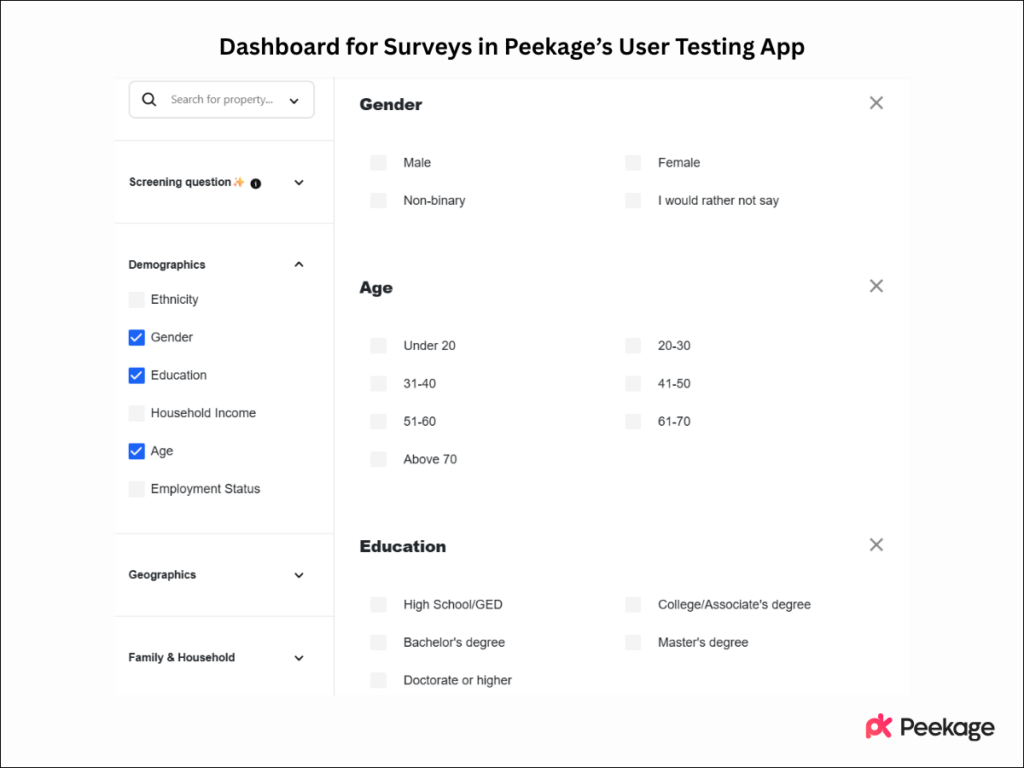
Step 2: Build Your Panel Using 200+ Attributes
Select your target audience using Peekage's 200+ filtering options like demographics, behaviors, and lifestyle traits. This helps you reach both current users and potential customers of your category. Strong targeting ensures your insights reflect real market behavior.
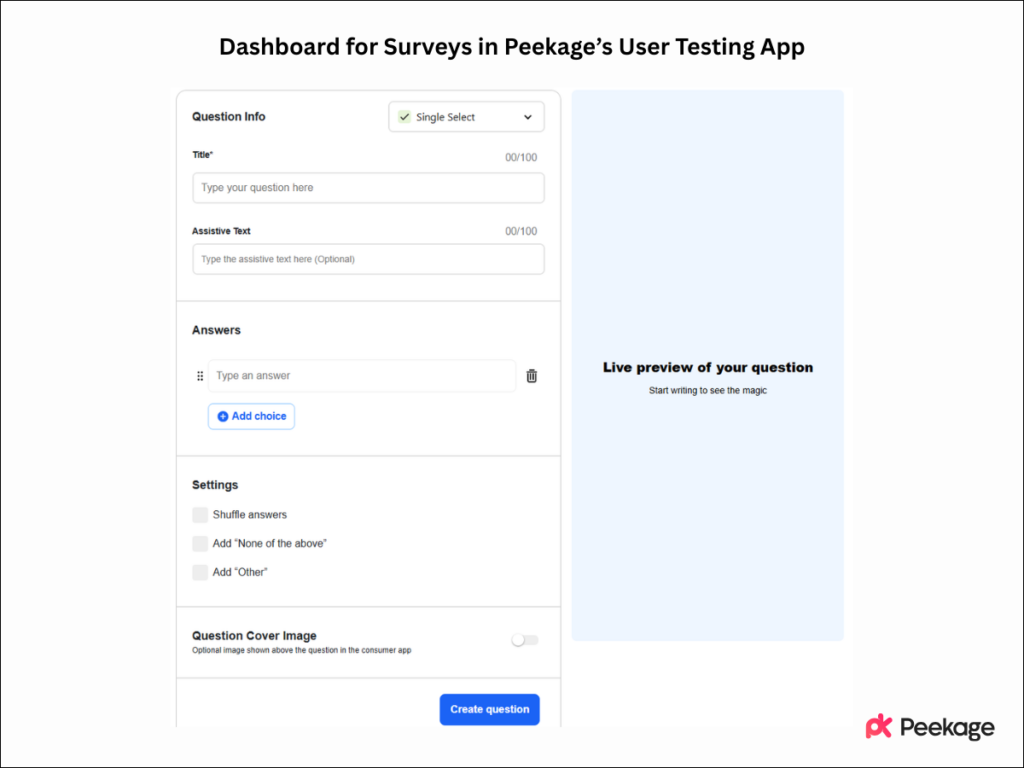
Step 3: Design Your Survey (or Review AI-Generated Version)
Create questions that cover usage patterns, attitudes, motivations, and barriers. If using AI, Peekage helps structure the survey and you simply review it before launch. The goal is to capture both what people do and why they do it.
Step 4: Send for Review and Launch
Submit your survey for Peekage's review to ensure clarity and quality. Once approved, launch it to your selected audience and start collecting responses. Built-in checks ensure reliable and high-quality data.
Step 5: Analyze Results and Make Decisions
Peekage's AI-driven assistant analyzes the data to uncover usage patterns, attitudes, and key customer segments. It highlights trends, pain points, and behavioral insights in a clear format. Based on this, it provides suggestions to help you improve products, messaging, or strategy decisions.
If you're ready to run your first U&A study, or you want to see how the process works inside one platform, check out Peekage's consumer insights tools or request a demo.
Real Examples of U&A Studies by Peekage
What Our Client Needed
A mid-sized ground coffee brand wanted to grow beyond the morning routine but didn't have a clear read on how category buyers actually used coffee throughout the day or how they felt about the brands they reached for. Leadership suspected there were untapped usage occasions and unmet needs, but decisions were being made on assumptions rather than evidence. They needed a foundational understanding of usage patterns, attitudes, and purchase drivers across the category, from both their own customers and competitor buyers, to ground their next product and positioning decisions in real consumer behavior.
What We Did
We ran an online usage and attitude study with a nationally representative sample of coffee category buyers, including the brand's own customers, competitor buyers, and lapsed users. The survey captured usage patterns such as frequency, occasions, and preparation methods, alongside attitudinal measures like brand perception, satisfaction, and category beliefs, plus purchase behavior covering triggers, channels, and price sensitivity. Matrix-style attitude questions and a few open-ended prompts were included to capture both measurable behavior and the reasoning behind it, with branding removed where needed to reduce social desirability bias.
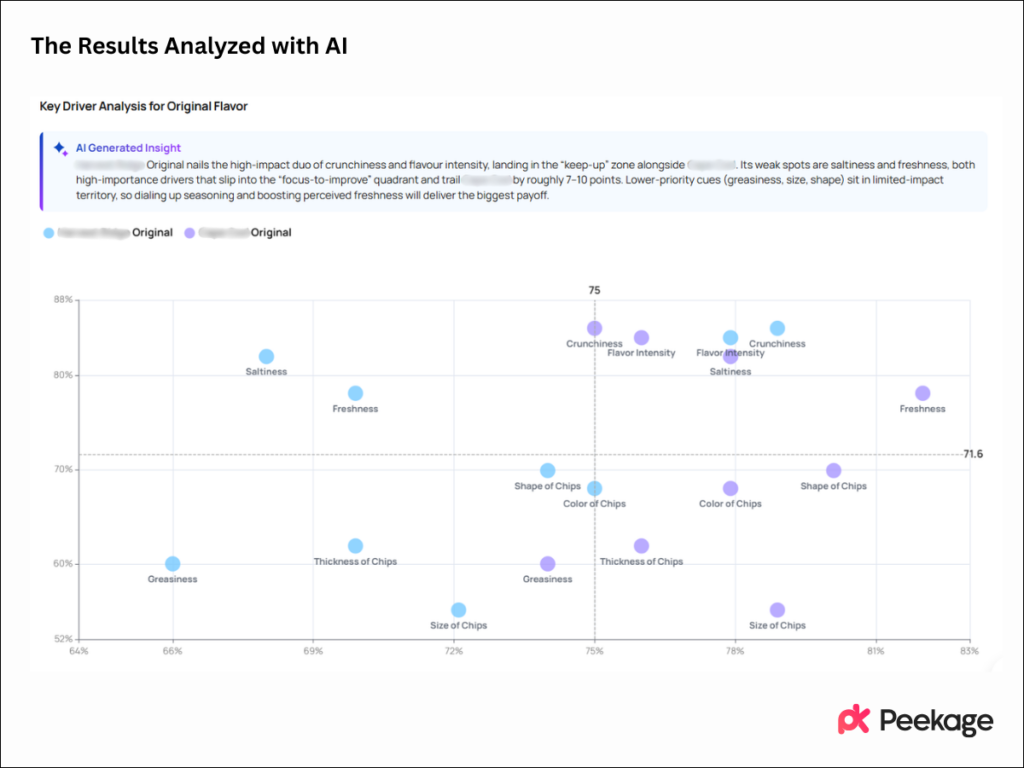
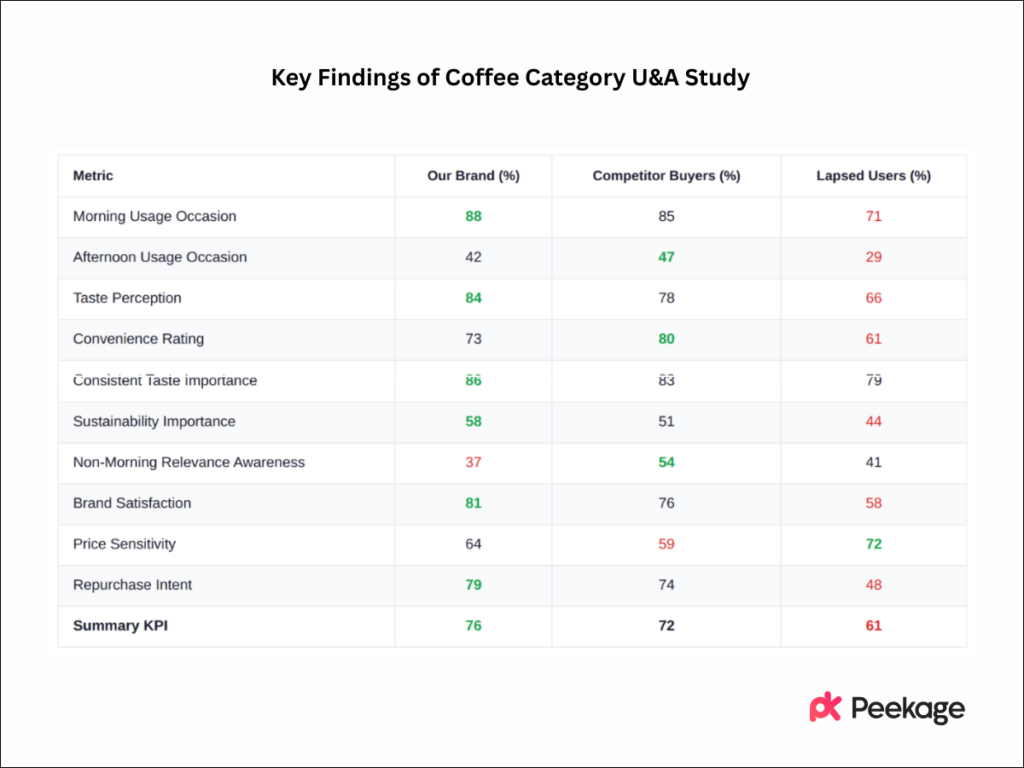
What We Found
The results showed that coffee consumption extended well beyond the morning, with a meaningful afternoon occasion that most category brands underserved, especially among younger and remote-working segments. Attitudinally, buyers rated convenience and consistent taste as the strongest drivers of brand choice, while sustainability claims mattered to a smaller but highly loyal segment. Although the brand performed well on taste perception, it lagged on awareness of its non-morning relevance, pointing to a clear positioning and messaging opportunity around afternoon and work-from-home occasions rather than a product gap.
FAQs
A well-run U&A study gives you a clear map of who your buyers are, how and when they use the product, what they like or dislike, and how they compare you to competitors. That translates into sharper product decisions, better targeted campaigns, and a stronger foundation for expansion or launch planning.
It depends on the objective. For category-level insights, include all category buyers, even competitor users and non-users of your brand. For brand-specific work, sample current users, lapsed users, and potential switchers. Avoid only surveying your email list, since it skews toward your most loyal customers.
Absolutely. An U&A study run 3 to 6 months before launch can confirm real consumer demand, identify which messages land best, pinpoint the right consumer segments, and show how the new product fits against competitors. That gives the team time to adjust before going to market.
A satisfaction survey focuses narrowly on current users and their experience with your product. An U&A survey goes wider: it captures data from users and non-users alike, covering awareness, competitive perceptions, purchase behavior, and usage occasions. Satisfaction surveys are a snapshot. U&A studies are the full picture.
Once a year at minimum. Brands in fast-moving categories like snacking, beverages, or beauty may benefit from quarterly pulses. Rather than one massive annual study, consider breaking it into smaller, ongoing research touchpoints that keep findings current throughout the year.


