Our Fall 2023 report unveils a consumer who's a bundle of contradictions; In this comprehensive report, we delve into the dynamic intersection of consumer preferences and innovation within the Consumer Packaged Goods (CPG) landscape. From breakfast habits to beverage choices and budgeting behaviors, we unpack key trends that define the consumer experience.
Consumer Trends: North Americans Lean into Quick Eats and Immune Boosters!
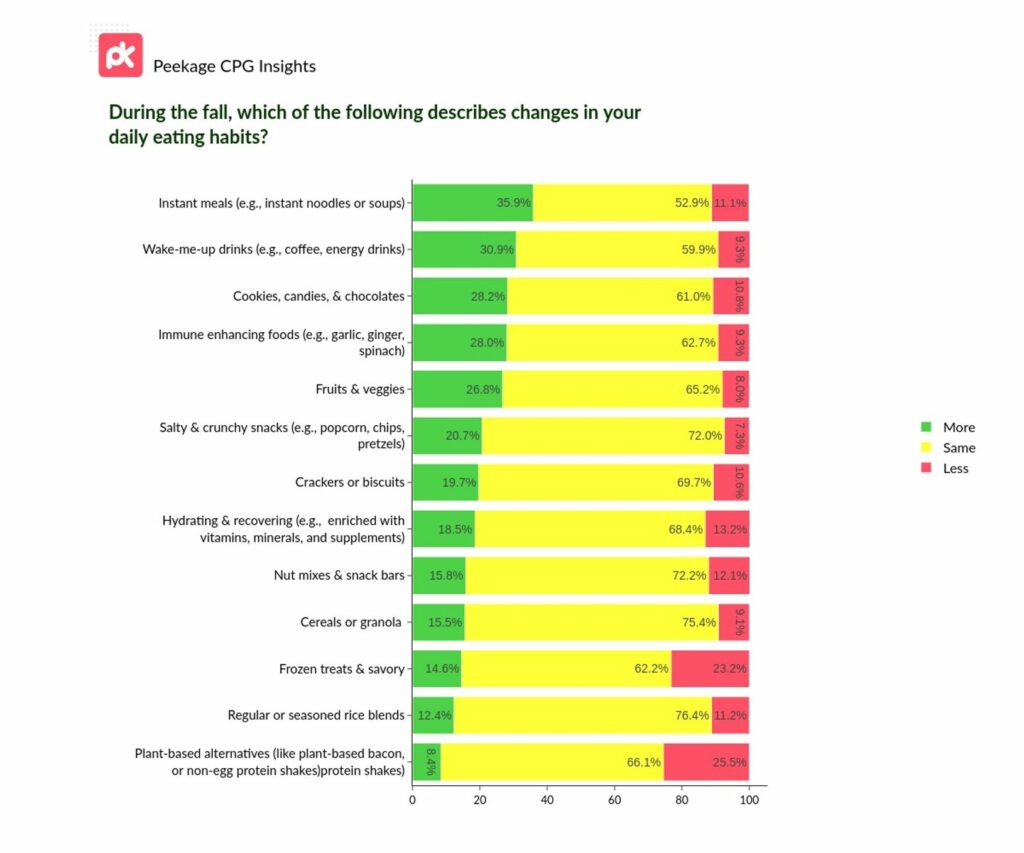
Quick Meals Catch On: While 53% remain consistent with their instant meal habits, an interesting ~36% are showing increased preference, suggesting busier lifestyles or colder weather quick fixes.
The Morning Fix: Coffee and energy drinks remain the wake-me-up choice for ~60%, with a notable ~31% reaching out even more as temperatures dip.
Sweet Tooth's Delight: Not only did ~28% confess to munching more on cookies, candies, and chocolates – sweet comforts for the cozy season, the majority haven't changed their sweet indulgences, balancing between health and hedonism.
Immunity is In: Immune-enhancing foods, with heroes like garlic and ginger, are favored by 28% more, reflecting wellness-oriented choices.
Veggie Vitality: While 65.2% keep their fruits & veggies intake consistent, there's a promising 26.8% who are adding more to their plates.
Crunch and Munch: Salty & crunchy snacks, like popcorn and chips, witness ~21% of consumers diving in more than usual, while 72% haven't changed their consumption habits.
Boost & Hydrate: While ~68% continue their usual intake of hydrating and recovery drinks (enriched with essential vitamins), it's noteworthy that 18.5% are ramping up their consumption, echoing an increased health focus.
Morning Routines Solidified: 75.4% keep to their cereals or granolas, proving breakfast rituals remain strong.
Cold Treats Cool Down: Despite their allure, frozen treats see a 23.2% decline in consumption as the mercury drops.
Rice: The Undying Staple: A commanding less than 75% have maintained their intake of regular or seasoned rice blends, a testament to its staple status.
Plant-Based Moderation: 66.1% reported their consumption of plant-based alternatives like plant-based bacon and non-egg shakes remains the same, hinting at an established user base.
Takeaway: The Fall 2023 data captures a mix of consistency and change in North American dietary choices. From holding onto beloved staples to making measured shifts towards health or convenience, the consumer's plate is both diverse and discerning.
Food Forecast: Consumers Crave Home Comforts While Keeping Convenience Close!
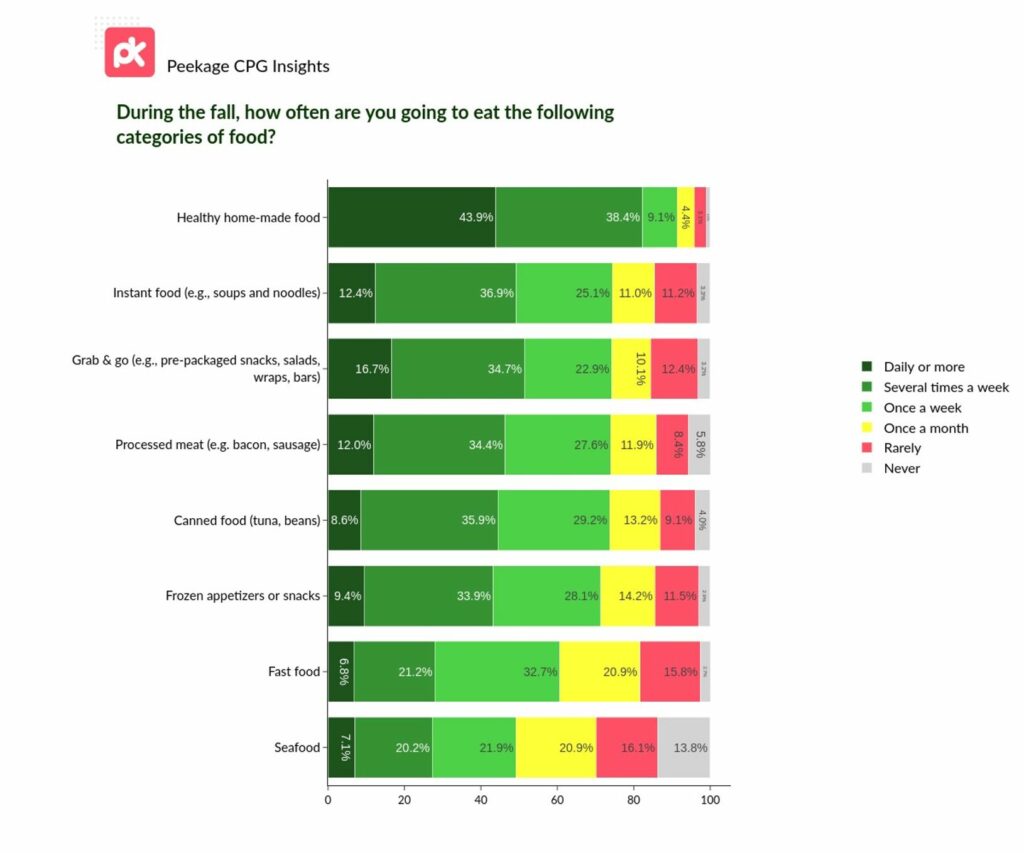
Healthy Home-Made Holds the Crown: A remarkable ~44% are dishing up healthy homemade meals daily! Add those eating homemade several times a week, and we're looking at an 82.3% preference rate. The home kitchen is clearly alive and well!
Instant Gratification: Nearly half (49.3%) are stirring up instant foods, like soups and noodles, either daily or multiple times a week.
Grab & Go Keeps Going Strong: less than 50% rely on the pre-packaged delights either daily or several times a week, emphasizing the need for on-the-move munchies. Only a minor 3.2% never opt for these quick bites.
Processed Meats Still Sizzling: Over 45% enjoy treats like bacon and sausage daily or multiple times a week, a nod to breakfast routines.
Can-Do Attitude to Canned Foods: Canned foods, like tuna and beans, see a 44.5% consumption rate either daily or several times a week. Just 4% say "Never" to the convenience of canned.
Frozen Appetizers Heat Up: ~43% munch on these snacks either daily or several times a week, indicating they're a go-to for many.
Fast Food Fix: While ~7% need their daily dose of fast food, a whopping 33% enjoy it "Once a week". Fast food abstinence is low, with just 2.7% swearing it off entirely.
Seafood Surprises! A combined ~50% of consumers are reaching for seafood several times a week or more. Only ~14% turn their nose up at seafood, saying they "Never" eat it.
Takeaway: As Fall 2023 approaches, it's clear that consumers are leaning toward home comforts. While convenience remains key, there's a notable trend towards healthier, homemade choices.
Breakfast Trends: Rise & Shine with What Consumers Crave!
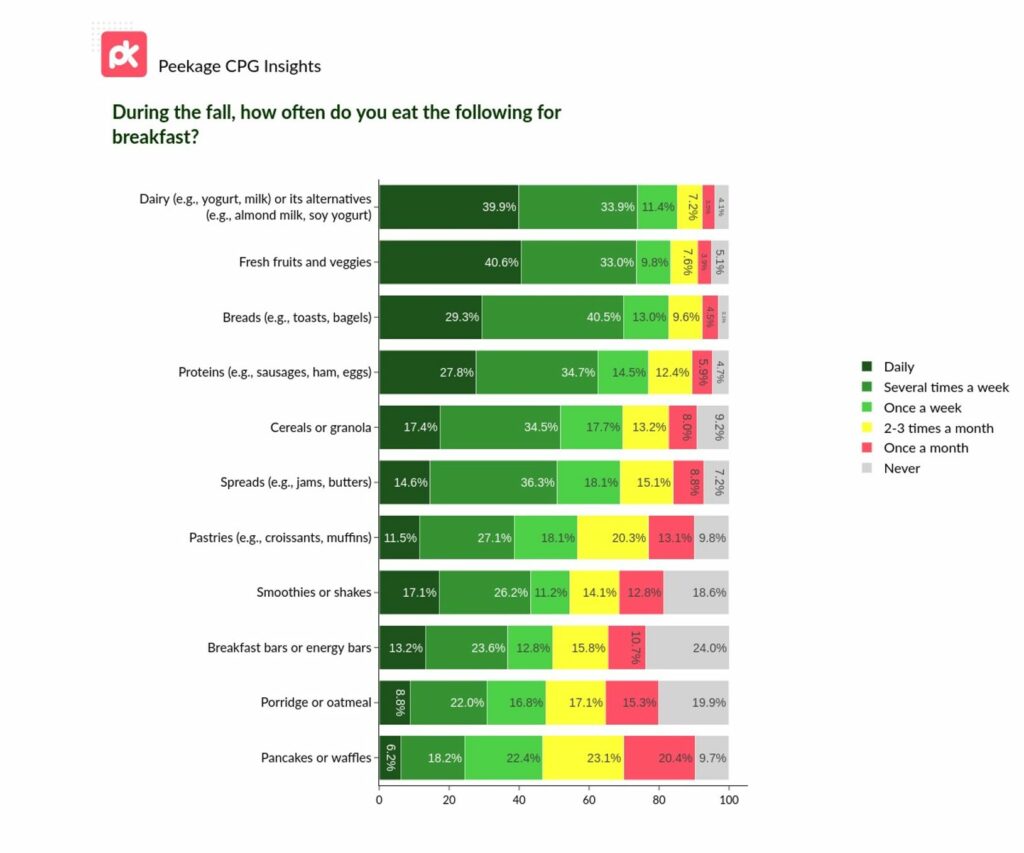
Dominant Dairy & Alternatives: Dairy or its alternatives are a hit, with ~40% indulging daily. A staggering 85.2% are sipping or spooning dairy and its alternatives at least once a week. Note that <5% who don't dairy-dabble.
Fruity Feasts: Two-fifths of consumers are packing their breakfast plates with fresh fruits and veggies daily, proving that fresh is best!
Bread's Robust Reign: Toasts and bagels hold the fort with a ~40% daily consumption rate, while just 3.1% pass on the carbs.
Protein Punch: Proteins like sausages and eggs are a daily staple for ~28%, and less than 5% are keeping their breakfast protein-free.
Cereal's Constant Charm: Daily cereal or granola breakfast bowls have a ~17% fan base, yet ~9% are switching things up elsewhere.
Spread the Word: A smashing ~70% are making spreads part of their weekly morning ritual. ~15% slather spreads like jams and butter daily, and only a tiny 7.2% resist the sweetness.
Pastry Passion: Daily indulgence in pastries like croissants and muffins is at ~12%, but they're off the menu for 9.8%.
Smoothie Surge: Smoothies or shakes have a dedicated daily following of 17.1% for breakfasts in the Fall. More than half of the consumers are making smoothies or shakes a part of their weekly breakfast menu.
Energy Bar Elevator: A notable 49.6% choose breakfast or energy bars every week, including ~13% of consumers who munch on these bars daily, proving their rise as an on-the-go staple.
Oatmeal Obsession: With 8.8% devouring it daily, porridge and oatmeal have carved out a dedicated daily niche.
Pancake & Waffle Wave: A cumulative 46.8% relish pancakes or waffles at least once a week. Morning sweetness is in demand!
Takeaway: Fall 2023 sees consumers diversifying their breakfast plates with a medley of tastes. CPG leaders, the menu's vast, and there's a slice of opportunity in every bite!
Beverage Breakdown: What's Brewing and Pouring in Consumer Preferences!
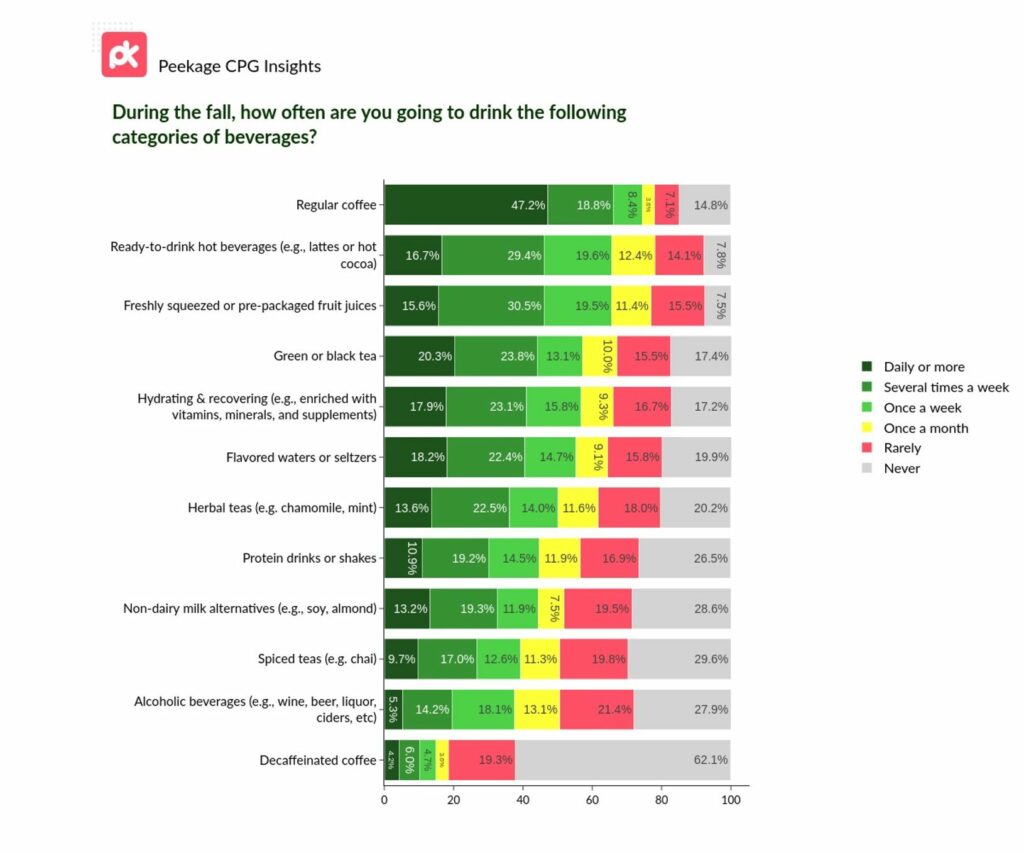
Coffee Kingpin Continues: A piping-hot ~50% of consumers enjoy their regular coffee daily.
Ready, Set, Sip: Ready-to-drink hot beverages like lattes and cocoa find favor with ~66% on a weekly basis. Convenience meets comfort!
Fruit Juice's Fresh Flourish: Two-thirds of consumers indulge in freshly squeezed or pre-packaged fruit juices at least once a week during the Fall. Juicy stats for the juicing giants!
Traditional Tea's Timeless Tug: Black and green teas retain their stronghold with 20% indulging daily. A tea-riffic testament to time-honored flavors!
Flavored Fizz & Hydrating Heroes: Flavored waters or seltzers bubble up with 55.3% enjoying weekly. Meanwhile, hydrating & recovering drinks, fortified with vitamins and more, quench 56.8% weekly!
Herbal Highs: Herbal teas, such as chamomile and mint, are the weekly choice for half of consumers during the fall. A zen blend for those cooler days!
Protein Prowess: less than 10% pump up with protein drinks or shakes daily.
Non-Dairy's Noteworthy Nudge: Two-fifths are reaching for non-dairy milk alternatives weekly. Plant power's pouring forth!
Spiced Teas' Spicy Status: ~40% warm up with spiced teas like chai every week, cementing its cozy reputation.
Alcohol's Ambient Affinity: While 5.3% indulge daily, a combined 37.3% sip alcoholic beverages weekly. Cheers to a leisurely fall!
Decaffeinated Dilemma: A mere ~15% opt for decaffeinated coffee weekly, but with a sizable ~62% giving it a pass, it remains a niche pick.
Final Pour: As the leaves turn, consumer beverage choices showcase a blend of comfort, health, and convenience. CPG leaders, here's your refreshing roadmap to what's in the glass this Fall 2023!
Beverage Bonanza: The Heartwarming Reasons Behind Every Sip!
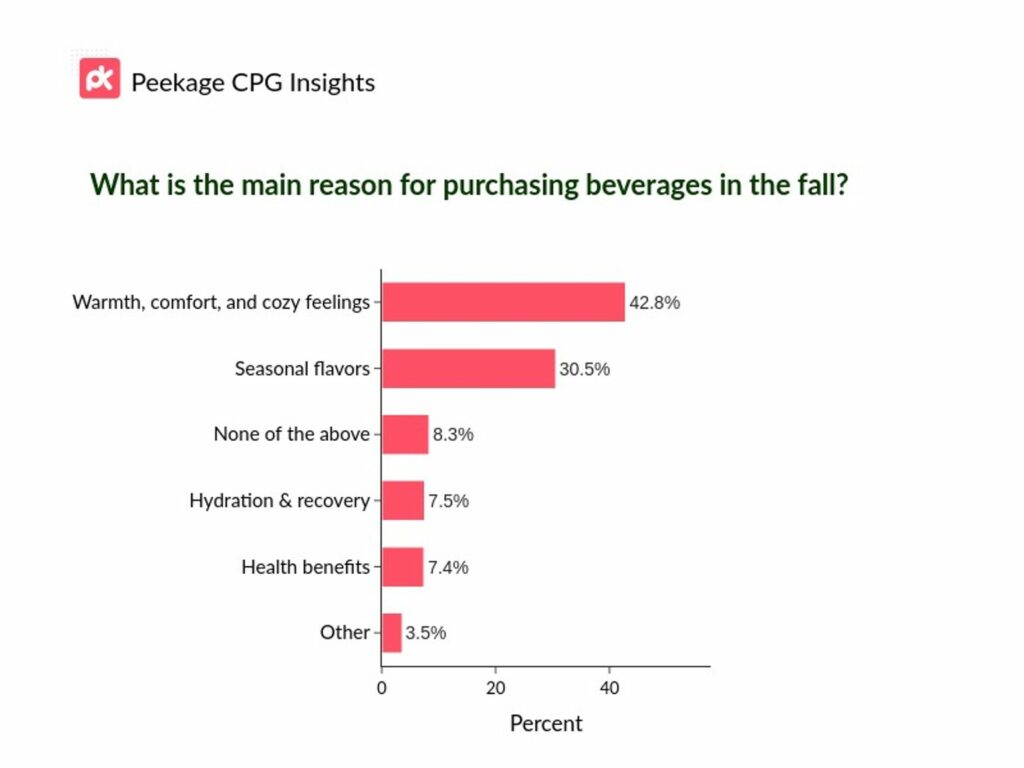
Cozy Comfort Conquers: A whopping ~43% reach for their beverages to indulge in warmth, comfort, and those signature cozy feelings. Fall's embrace in a cup!
Seasonal Sensations Soar: ~31% are charmed by the seasonal flavors. Pumpkin spice, apple cinnamon - autumn's palate has its passionate patrons!
Hydration & Hustle: 7.5% are still chasing hydration and recovery with their Fall beverage choices, proving fitness doesn't falter in the fall.
Healthy & Hearty: 7.4% prioritize health benefits in their Fall beverages, ensuring wellness remains a warm trend.
Fall Frenzy: Americans' Alcoholic Expenditure Revealed!
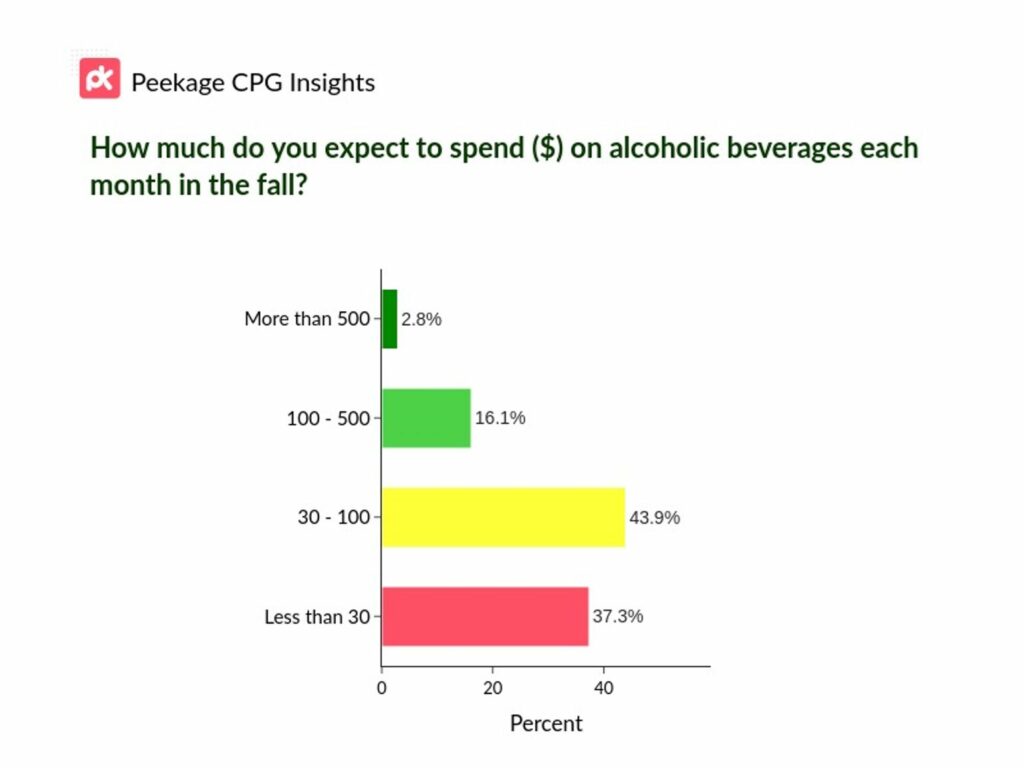
Frugal Cheers: Over a third (37.3%) plan to keep their monthly expenditure below $30. Toasting on a budget!
Most Opt for Moderate Spending: A whopping ~44% of respondents anticipate spending between $30 and $100 on alcoholic beverages each month this fall.
High Rollers Enter the Scene: Notably, 16.1% of consumers are ready to splurge with a monthly budget of $100 to $500.
Elite Sippers: A small yet significant 2.8% are going all out, expecting to spend more than $500 monthly. Talk about luxury libations!
Takeaway: As fall 2023 approaches, brands should tap into diverse spending patterns, from budget-friendly options to premium selections, to maximize their market presence.
Home Cooking Heats Up: Spending Trends Unveiled
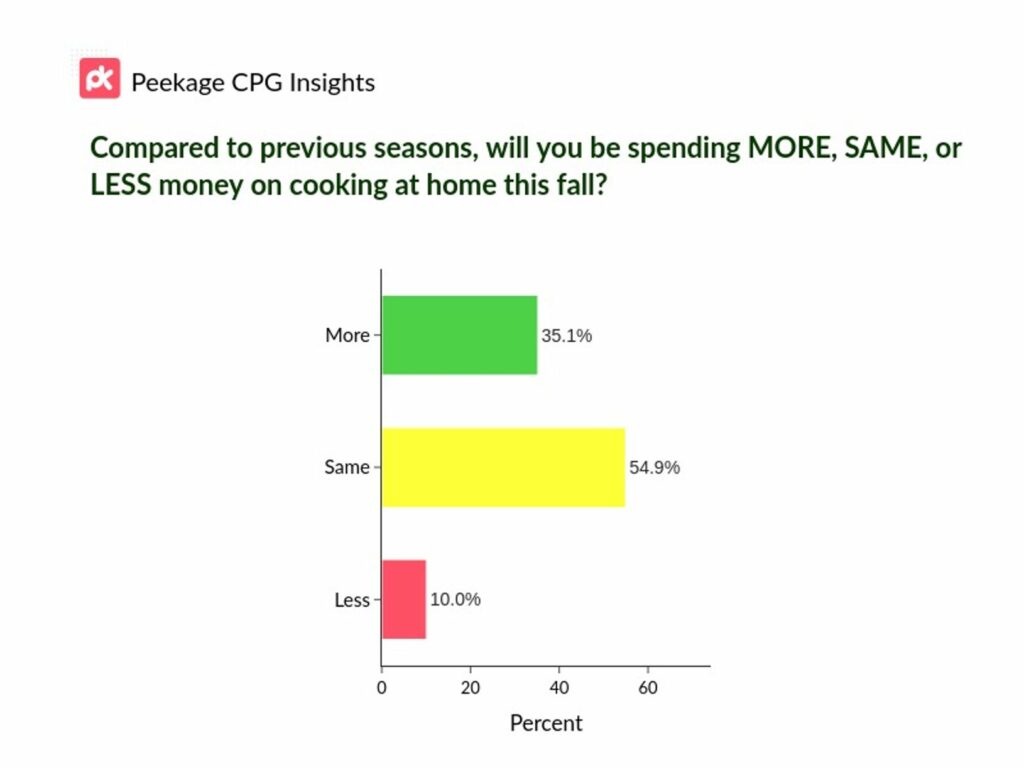
The Culinary Climb: A significant ~35% anticipate splurging more on whipping up meals at home this season.
Steady as She Cooks: Over half (~55%) plan to maintain their culinary budgets, indicating a consistent appreciation for home-cooked meals.
Budget Bites: Just 10% forecast a reduction in home cooking expenditure, suggesting the trend for dining in remains strong.
Takeaway: As the aroma of home-cooked meals wafts across households, brands should capitalize on this upward trajectory. Whether it's premium ingredients or innovative kitchen recipes, the market is ripe for culinary enhancements that resonate with the modern home chef.
Lunchtime: Americans' Dining Choices Spill the Beans!
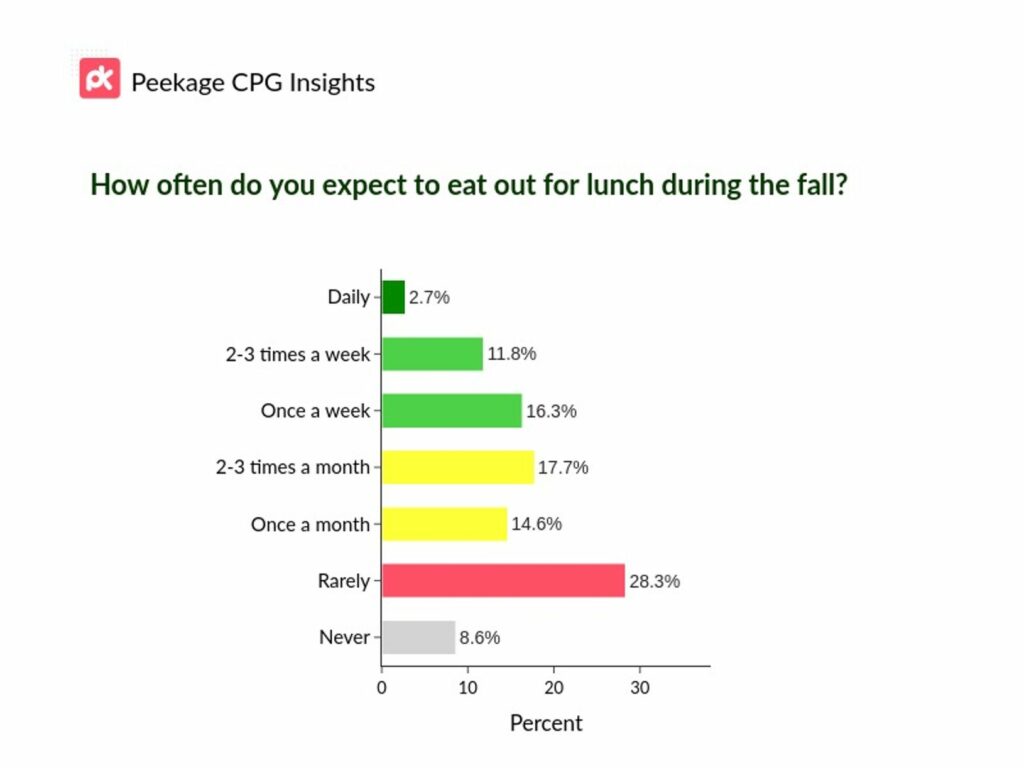
Everyday Eaters: A modest 2.7% of folks are all in, choosing to dine out daily during lunch hours. The convenience crew!
Weekly Wonders: A combined ~28% will be making their lunch outings 2-3 times a week or once a week. That's over a quarter of respondents!
Occasional Outgoers: 32.3% prefer to limit their lunch outings, opting for 2-3 times a month or just once a month. The once-in-a-while treat!
Infrequent Indulgers: With ~37% choosing to eat out never or rarely during the fall, it's clear that home-cooked or packed lunches still have their charm. Old-school cool!
Takeaway: Fall 2023 forecasts a mixed plate of preferences for lunch. While weekly outings remain popular, there's a notable shift towards less frequent dining out, opening a door for businesses to explore take-home and DIY meal solutions.
Dining time: Do Americans' Wallets Open Wider or Tighten Up?
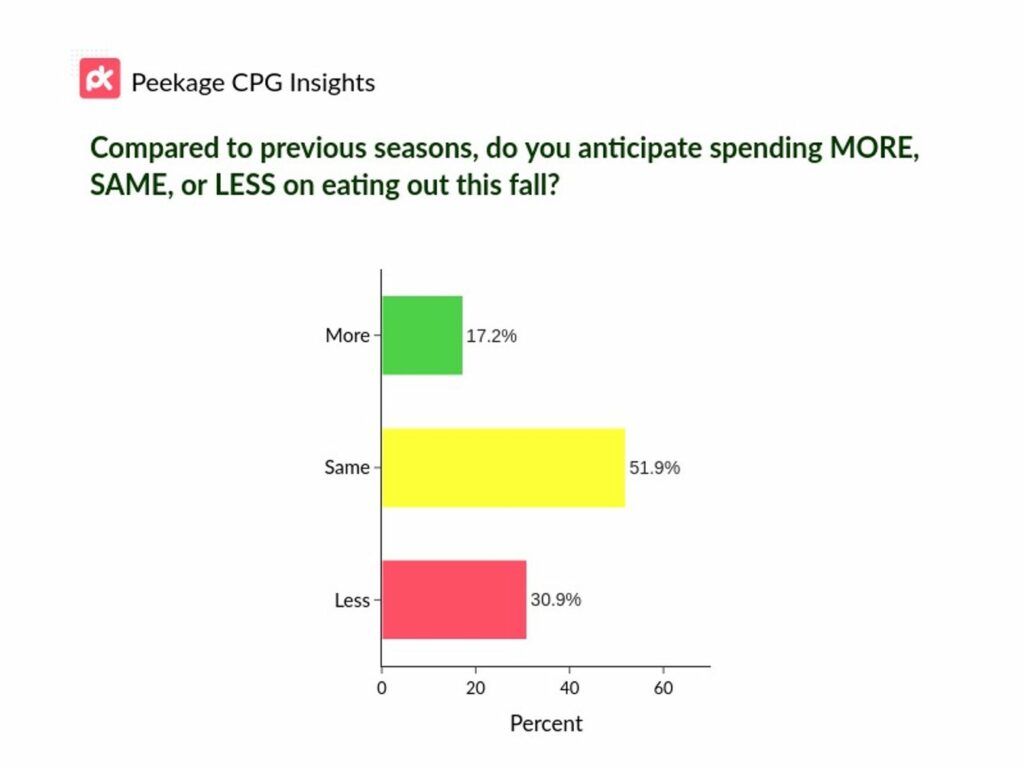
Hungry for More: A spirited ~17% of diners are craving change, gearing up to spend more on eating out this fall. The food scene enthusiasts!
Consistent Culinary Connoisseurs: Over half of consumers plan to maintain their spending habits from previous seasons. Steady as they dine!
Budget Bites: The savings squad is growing strong with ~31% anticipating cutting back on their dining expenses. Savvy savers or home chefs rising?
Takeaway: Fall 2023 sees a clear majority holding steady on their dining expenditures. Yet, with nearly a third contemplating a reduction, eateries may need to season their offerings with value deals or novel experiences to keep consumers biting.
Dining Out: Americans' Spending Habits Unveiled!
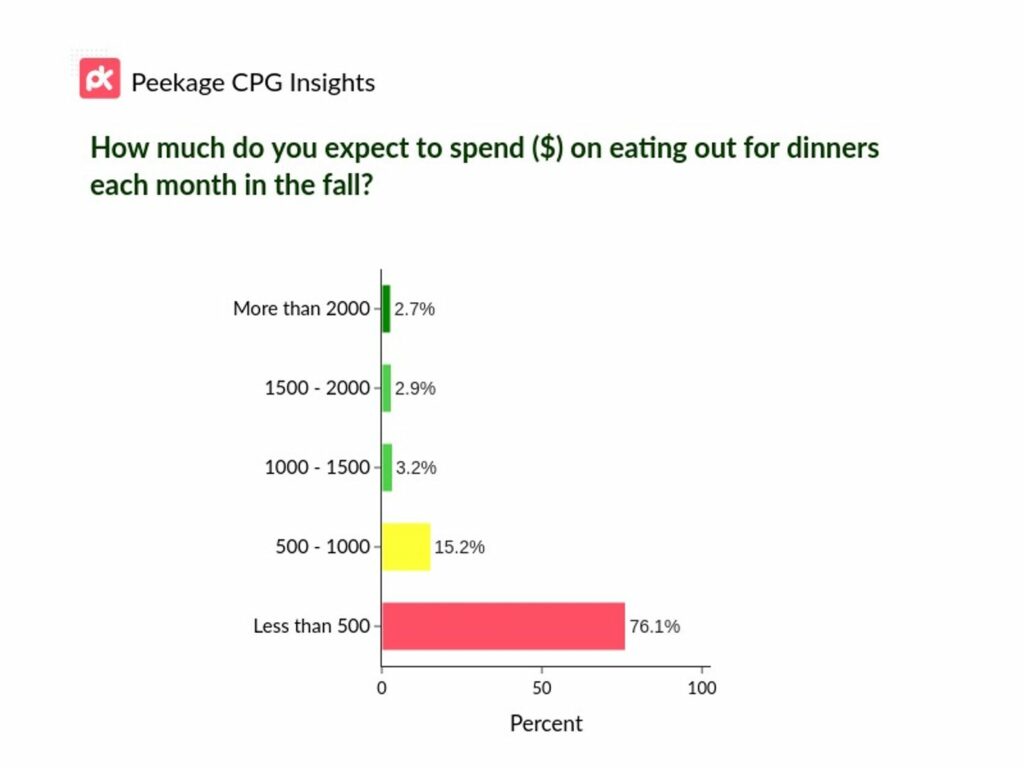
Budget Bites Dominate: An overwhelming less than 75% of respondents plan to spend less than $500 monthly on dining out for dinner. Casual dinners are in!
Mid-Tier Meals Gaining Ground: A sizable ~15% anticipate their monthly dinner outings to cost between $500 and $1000. Think bistros and specialty cuisine!
Premium Plates for the Few: Venturing into the higher end, 3.2% foresee spending between $1000 and $1500, while 2.9% peg it between $1500 and $2000. Gourmet galore!
High Dining, Sky-High Budget: The elite 2.7% are prepared to splurge over $2000 each month. Luxury dining experiences take the cake!
Takeaway: Fall 2023 highlights a clear trend toward budget-friendly meals, but there's also a significant niche seeking upscale dining experiences. Restaurants and diners should diversify their offerings to cater to this wide range of spenders.
Grocery Insights: A Deep Dive into North American Shoppers' Trolleys and Thoughts
How Often Do Shoppers Really Shop?
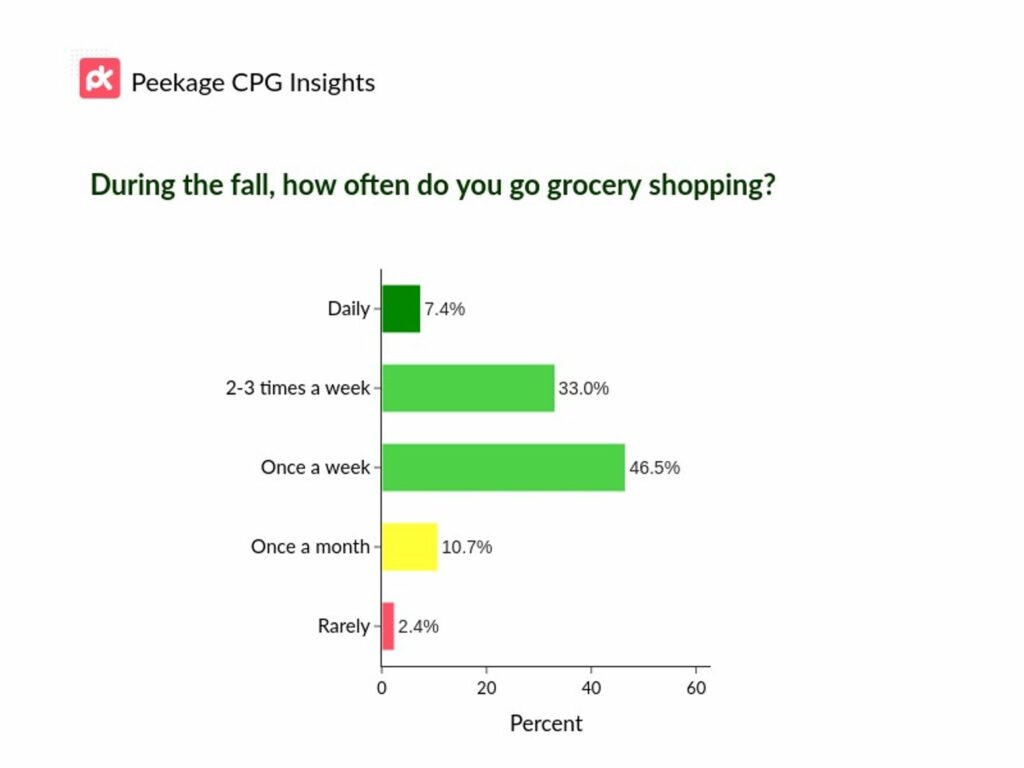
Daily Dashers: 7.4% hit the aisles every single day! Freshness fiends?
Frequent Fillers: 33% stock up 2-3 times a week, keeping pantries perpetually packed.
Weekly Wanderers: A dominant 46.5% keep it consistent with weekly visits. A schedule they swear by!
Monthly Minders: 10.7% go big and go home with monthly hauls. Bulk buyers?
Consumer Priorities Unveiled: What's REALLY Driving Grocery Choices?
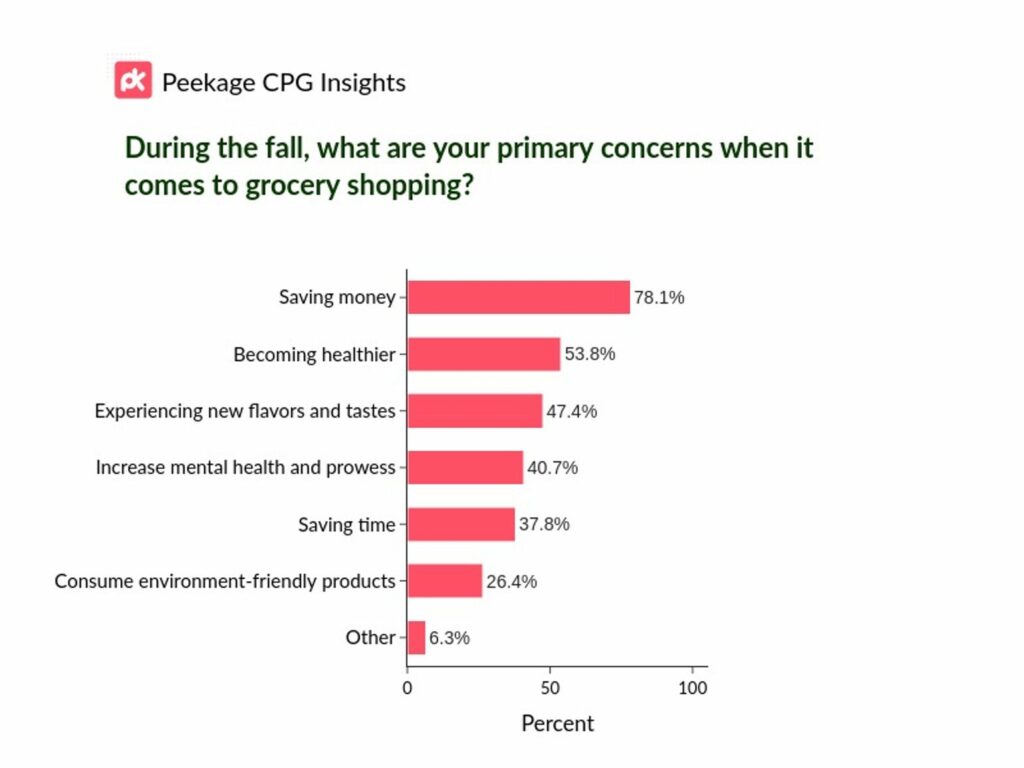
Budget Buffs: An overwhelming ~78% keep their eyes on the price, hunting those deals. Savings is king!
Health Hopefuls: More than half, ~54%, cart out with a health-first mindset. Healthier over goodies!
Taste Travelers: ~47% chase new flavors, with taste adventures on every trip. A world in a bite!
Mindful Mavens: Two-fifths factor in groceries' influence on mental agility. Brain-food believers!
Quick Questers: ~38% are on a time-crunch, making swift selections. Swift, but specific!
Eco-Engagers: More than a quarter prefer their purchases planet-friendly. Earth's champions in every checkout!
Grocery Wallet Watch: How Much Are Shoppers REALLY Spending?
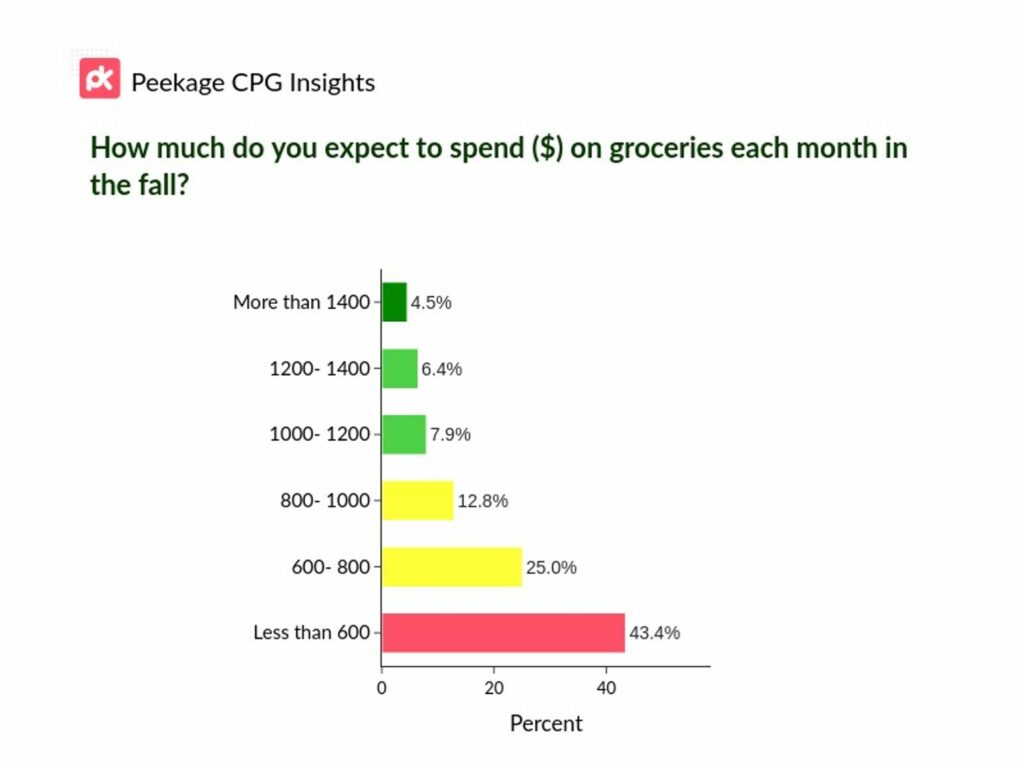
High Rollers: ~11% shell out a whopping $1200 or more. Gourmet or grandfamilies?
Middle Grounders: Combining tiers, a sizable ~46% earmark between $600 to $1200. Balancing quality with quantity.
Budget Ballers: A massive ~43% keep it under $600, mastering the art of frugal feasting. Value victors!
Takeaway: As we enter Fall 2023, it's evident: Weekly grocery outings dominate, savings reign supreme, yet taste and health aren't compromised. Brands can tap into these consumer habits by offering value-packed products that don't skimp on quality or flavor.
Festivities Forecast: When Do Shoppers Gear Up for Holiday Hustle?
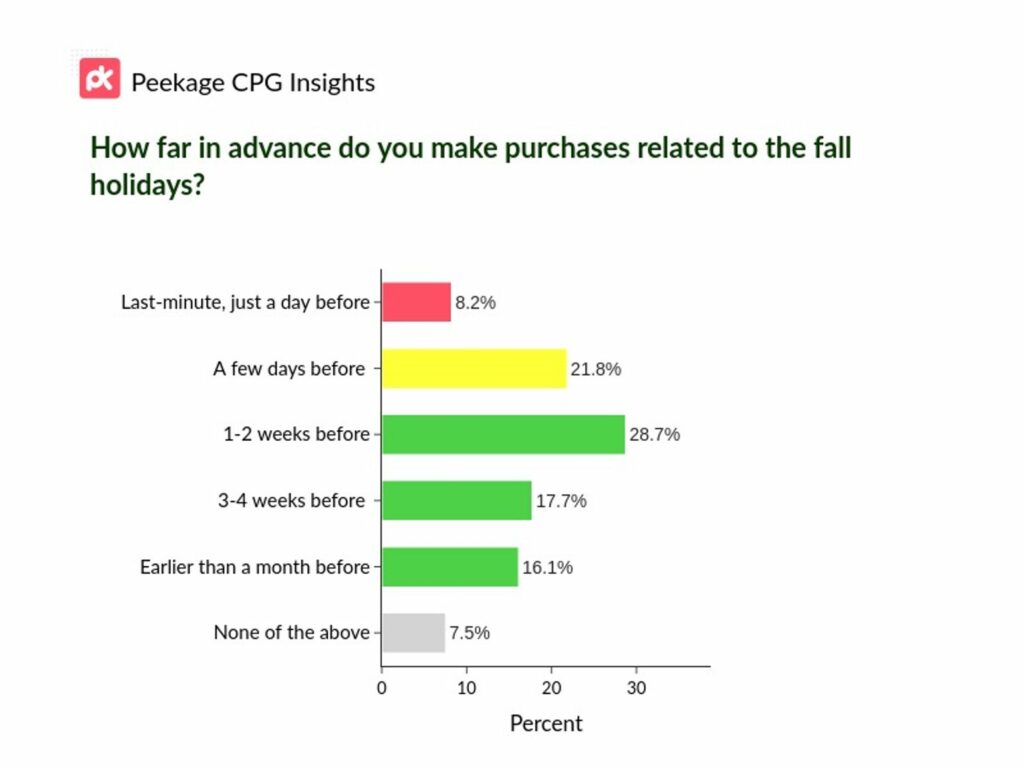
Clock's Ticking! : ~8% ride the adrenaline, making their holiday purchases just a day before the celebrations.
Just in the Nick of Time: ~22% opt for a slight buffer, securing their festive needs a few days in advance.
Planners at Play: A notable ~29% start their shopping spree 1-2 weeks before, ensuring they aren't caught off guard.
The Early Birds: Over a third (33.8%) are ahead of the game, making their purchases anywhere from 3-4 weeks to over a month in advance.
Takeaway: The fall holiday shopping spectrum is vast, but one thing's clear: a majority prefer a pre-planned approach. For brands, this signifies the need to kickstart promotions and offerings well in advance of the holiday rush, ensuring they cater to the meticulous planner and the eleventh-hour shopper alike.
Grocery Gauntlet: Where Shoppers Are Swiping Their Cards!
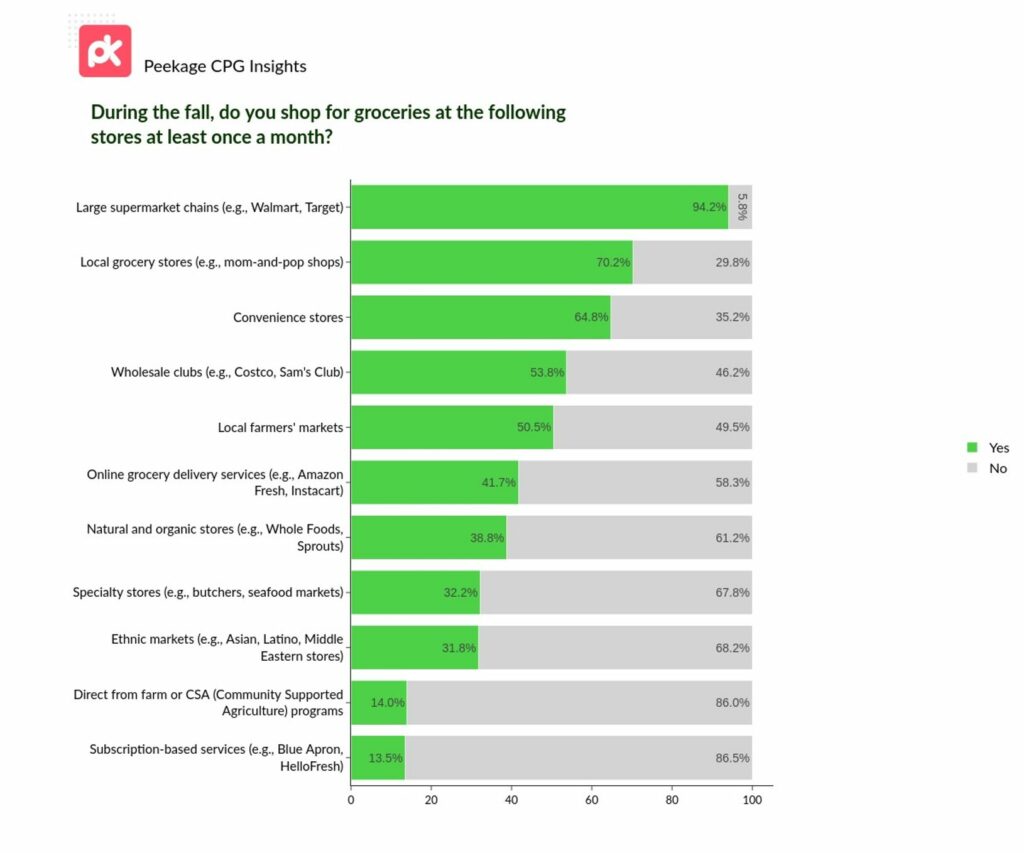
Supermarket Sweep: A staggering ~94% are walking the aisles of giants like Walmart and Target every month. Undoubtedly the titans of the grocery world.
Local Love: ~70% support their neighborhood grocers. Community and connection in every purchase.
Convenience Crusaders: For ~65%, monthly drop-ins at convenience stores are non-negotiable. Quick fixes at every corner!
Club Crowd: ~54% are cashing in monthly on bulk bargains at wholesale titans like Costco and Sam's Club. More bang for the buck!
Market Maestros: Nearly half are anchored to their local farmers' markets monthly. Farm-to-table? Yes, please!
Digital Diners: ~42% have set sail in the sea of online grocery deliveries. Click, cart, convenience!
Whole Foods Faithfuls: ~39% maintain a monthly pilgrimage to organic hubs like Whole Foods and Sprouts. Wellness in every cart!
Specialty Store Scouts: ~32% are anchored to stores like specialty butchers and seafood markets each month. Only the finest cuts and catches!
Global Gourmets: ~32% embark on monthly quests to ethnic markets. The allure of international tastes persists.
Farm-Fresh Fanatics: 14% are dialing into direct farm or CSA programs monthly. Authenticity at its finest?
Subscription Seekers: Only 13.5% rendezvous monthly with subscription-based services like Blue Apron and HelloFresh.
Takeaway: This Fall, from the digital docks of Instacart to the vast aisles of Walmart, consumer choices are vast and varied. The mosaic of monthly commitments offers an illuminating road map for CPG industry leaders. Navigate wisely!
Gut Health Trends Revealed: Consumers Tune Into Tummy-Targeted Diets!
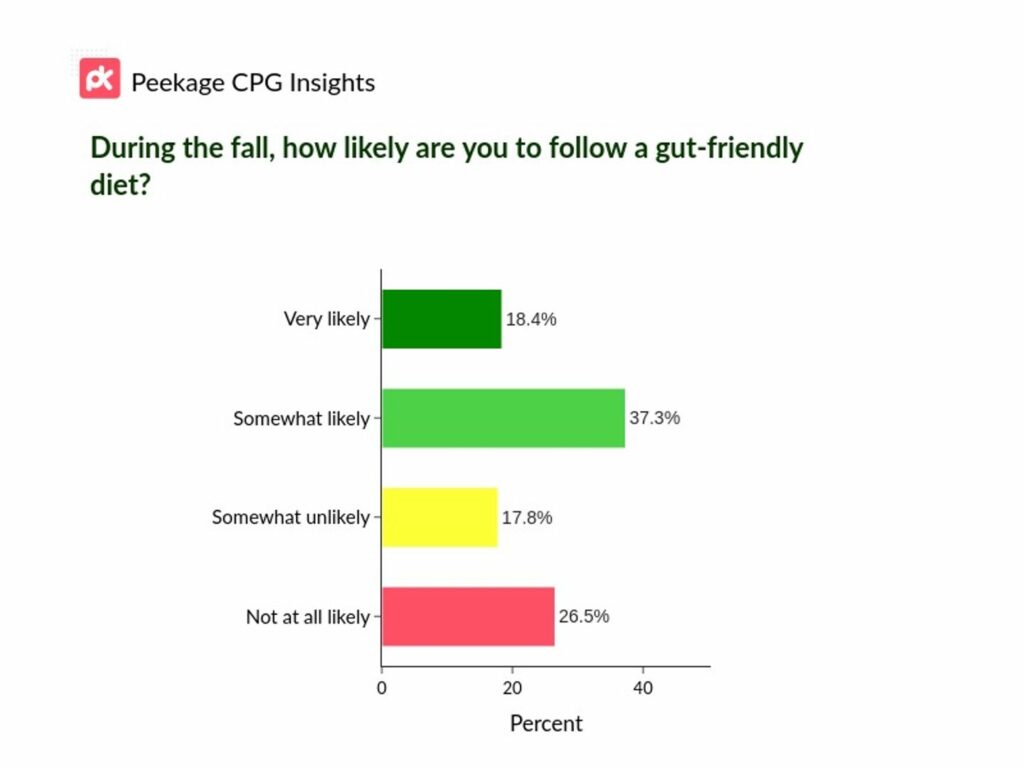
Fully Committed: ~18% of consumers are very likely to adopt a gut-friendly diet this fall, showcasing a strong inclination towards gut health.
Open to the Idea: A significant ~37% express they're somewhat likely to embrace gut-focused nutrition. They're curious, but not fully sold.
On the Fence: ~18% remain hesitant, being somewhat unlikely to adjust their meals for gut health.
Staying Traditional: A noteworthy 26.5% are steadfast in their current dietary choices, stating they're not at all likely to pursue a gut-friendly diet.
Lifestyle Lens: Hobbies & Learning Eclipse Traditional Roles, Revealing Fresh Consumer Dynamics!
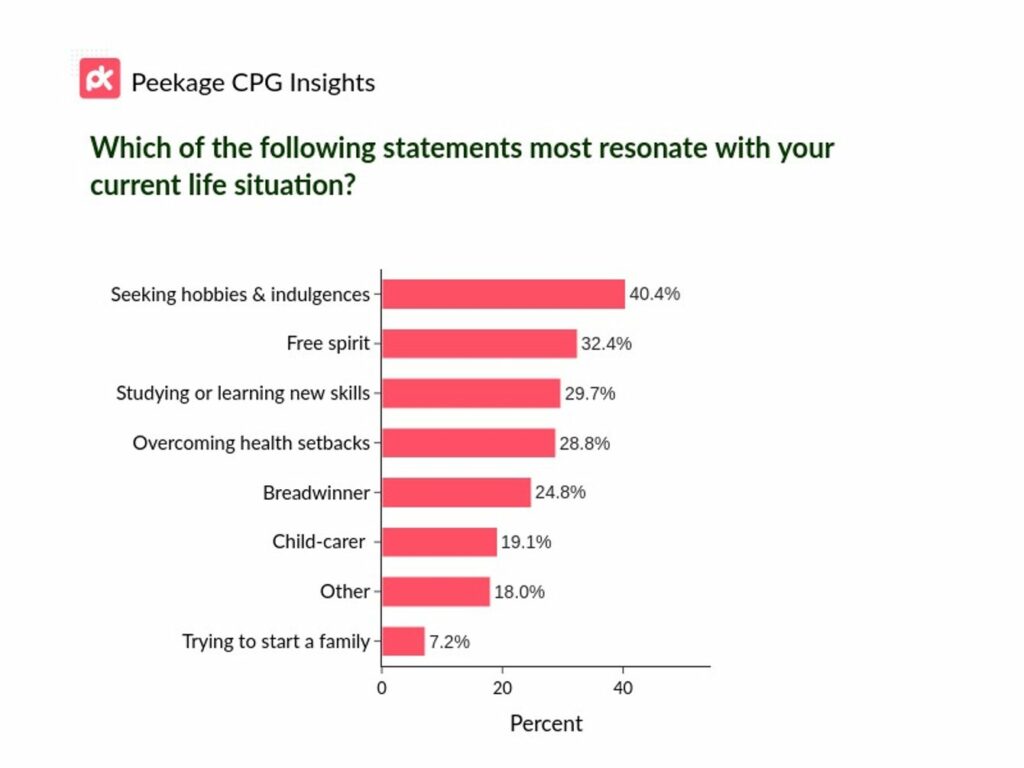
Indulgence Seekers: A notable ~40% of North American consumers are diving deep into hobbies and indulgences, showcasing a modern surge in self-expression and personal time.
Embracing Freedom: A liberating ~32% identify themselves as free spirits, hinting at a spontaneous demographic that values flexibility and spontaneity.
Learning Lifelong: ~30% of participants are passionately "hitting the books", indicating a strong trend of continuous self-improvement and evolving skill sets in today's world.
Health: The New Frontier: With ~29% navigating health setbacks, wellness-focused products and services are imperative for the CPG industry to meet this growing need.
Busy Breadwinners: ~25% still identify primarily with the breadwinner role, underlining the continued importance of products that cater to this segment.
Child-carers: A noteworthy ~19% resonate with the child-carer role, shedding light on a substantial segment that prioritizes busy lifestyles, child-centric products, and services.
Aspiring Families: 7.2% are on the journey of starting a family, a niche yet vital segment for the CPG industry to understand and serve, given its transformative life implications.
Takeaway: As 2023 unfolds, the shift from conventional life roles to a blend of individualistic pursuits and challenges is evident. CPG leaders must pivot and adapt to these intricate consumer stories, crafting offerings that resonate with their evolving journeys.
Lifestyle Nuances Shape Grab & Go Choices
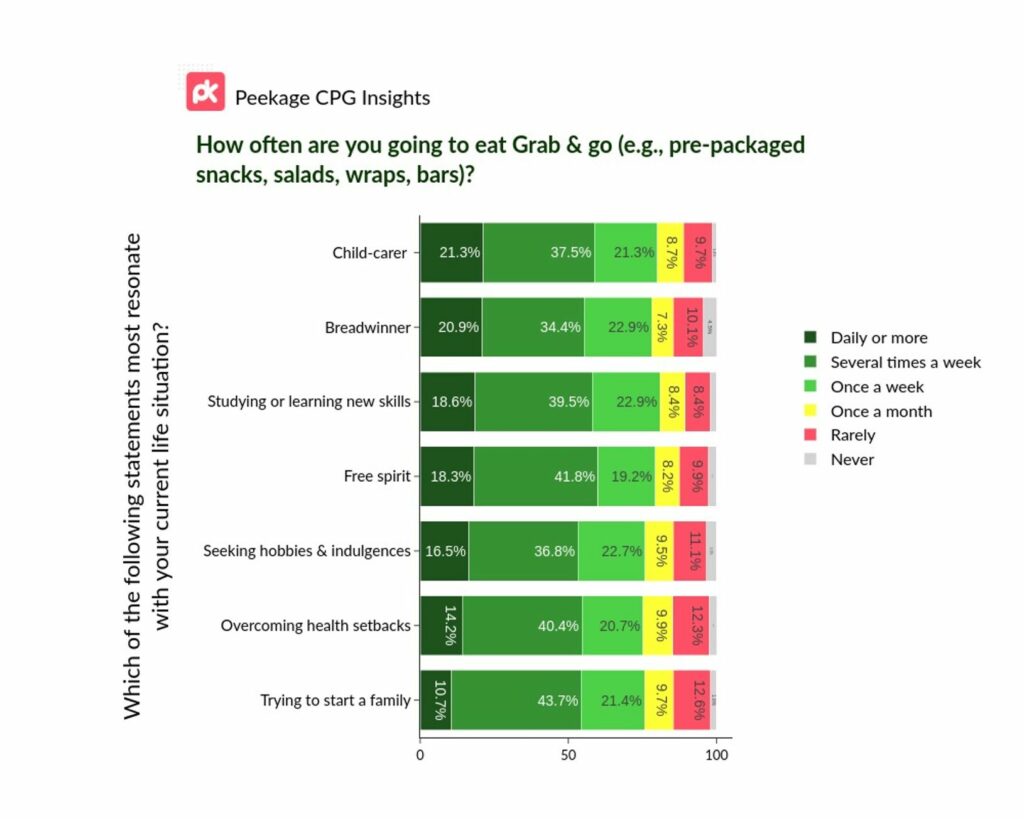
Child-carers Seek Convenience: While 21.3% of Child-carers go for Grab & Go daily, their combined frequent consumption shows the products' inherent ease for their lifestyle.
Breadwinners Lead the Daily Charge: ~21% of Breadwinners opt for Grab & Go options daily, revealing the demands of their fast-paced life.
Learners Fuel Up Grab & Go Frequently: Those engaged in studying or acquiring new skills, with ~58% reaching out for Grab & Go either daily or multiple times a week, need to feed their focus!
Free Spirits are Frequent Grab & Go Indulgers: A total of ~60% of Free Spirits make Grab & Go choices either daily or several times a week, highlighting their preference for flexibility.
Hobby Enthusiasts Need Swift Meals: For those seeking hobbies & indulgences, 53.3% resort to Grab & Go daily or a few times each week, showing the balance between recreation and rapid sustenance.
Recovering Groups are Consistent Eaters: <15% of those overcoming health setbacks choose Grab & Go daily, indicating their alignment towards healthier, quick options. However, their weekly consumption rate supports their acceptance of healthy Grab & Go products.
Aspiring Families Mix it Up: Though only ~11% of those trying to start a family pick Grab & Go daily, a considerable 43.7% do so several times a week, suggesting they value on-the-move munchies.
Takeaway: From the daily rush of Breadwinners to the varied tastes of Aspiring Families, Grab & Go caters to a vast spectrum. As 2023 moves forward, there's a clear window for the CPG industry to refine its offerings for these discerning, lifestyle-driven consumers.
The Canned Food Chronicles: Diverse Lifestyles Dishing Up on Convenience!
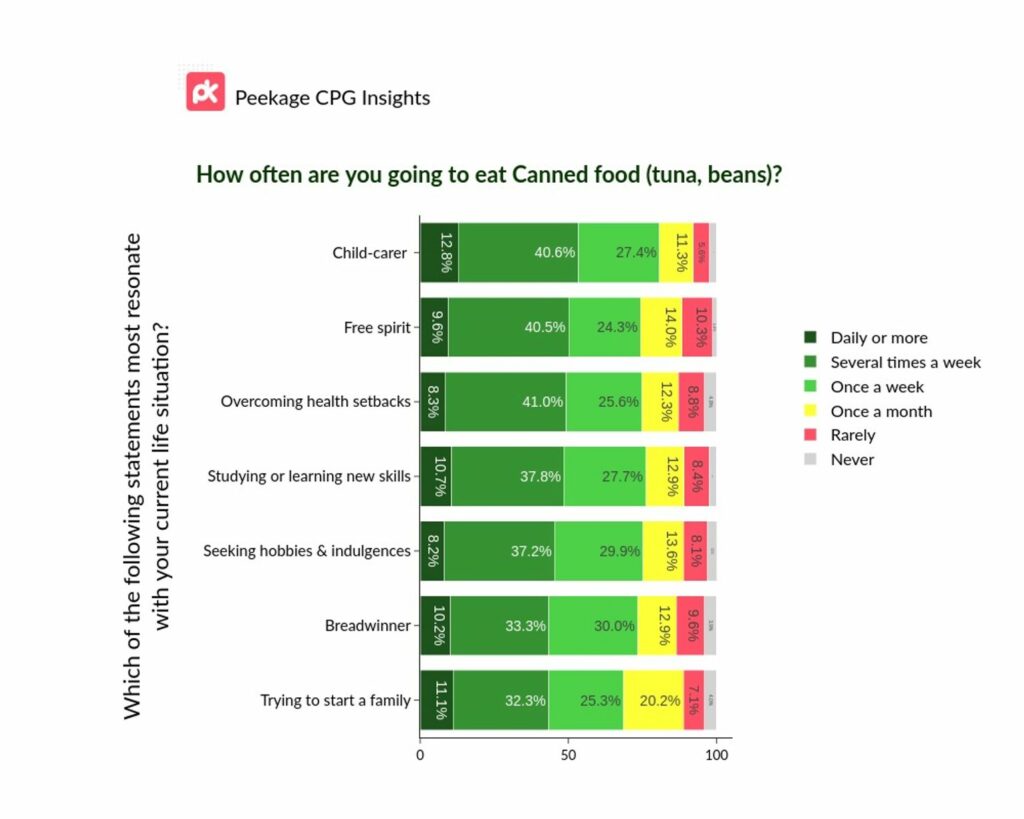
Child-carers' Can-do Attitude: Among Child-carers, canned food is a star! A whopping ~53% indulge either daily or a few times weekly, highlighting convenience in their care-giving routine.
Free Spirits Flaunt Flexibility: With a considerable ~40% of Free Spirits enjoying canned food multiple times a week, the balance between spontaneity and ready-to-eat is evident.
Health Seekers' Canned Commitments: Those overcoming health setbacks stand out with 41% selecting canned options multiple times a week. Quick, nutritious choices support their recovery.
Skill-seekers Bank on the Can: For those immersed in learning, a sum of ~49% resort to canned foods daily or several times a week, illustrating the sustenance needed for their cerebral pursuits.
Indulgence Seekers are Occasional Can-fanatics: While 8.2% of the hobby enthusiasts open up a can daily, a good 37.2% do so multiple times a week. Even leisure needs a quick, tasty bite!
Breadwinners & Canned Staples: ~10% of Breadwinners munch on canned food daily, while an impressive 33.3% incorporate it several times a week, echoing the blend of speed and nutrition.
Family Hopefuls & Assorted Tastes: As they embark on family planning, ~43% of these individuals turn to canned foods either daily or several times weekly. Diverse eating patterns mark their journey!
Takeaway: As 2023 shapes up, can food hold its ground across lifestyles. From speedy meals for the breadwinners to nourishing bites for those charting new life courses, the CPG industry's canned offerings continue to be a pantry mainstay.
Lifestyle Lens: How Life Narratives Shape Instant Food Preferences!
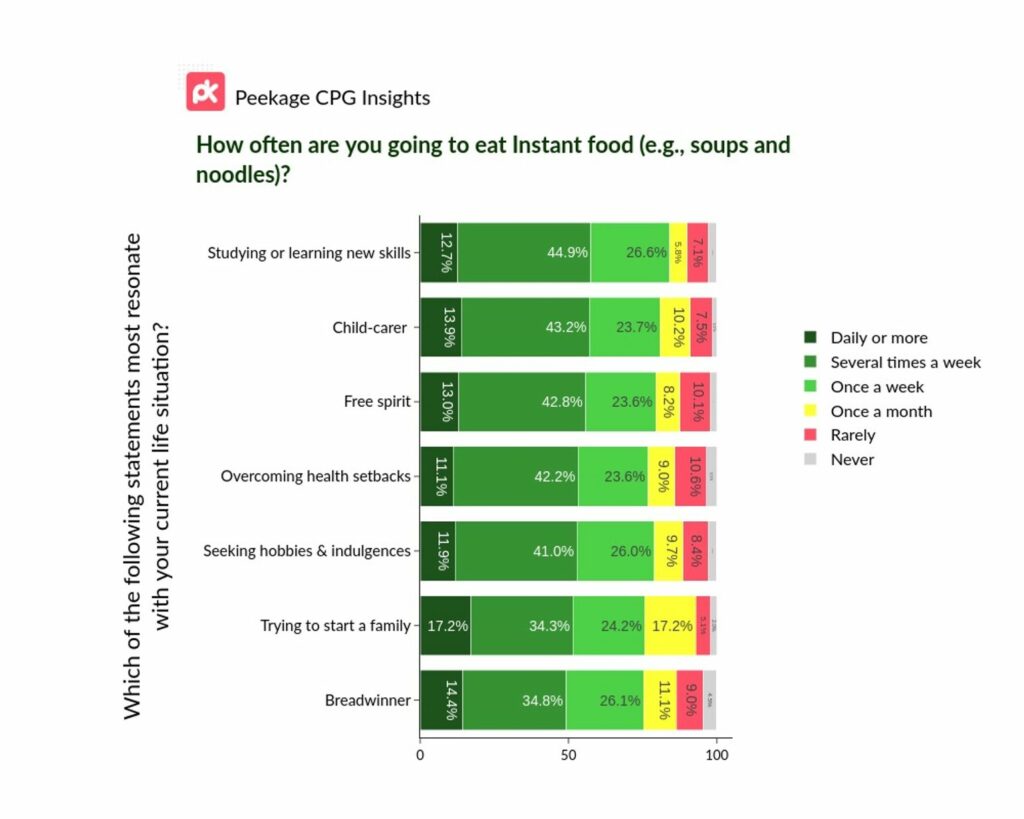
Study Buffs Rapid Refuels: Leading the cohort, a massive ~58% of the learning-driven demographic are turning to instant meals either daily or multiple times weekly.
Child-carers' Time-crunch: Juggling care and personal time, a notable ~57% opt for instant meals daily or several times a week.
Free Spirits Soar with Speed: ~56% of these spontaneous souls lean on instant delights either daily or several times a week. Their free-flowing nature reflected in their food choices.
On the Mend, On the Move: Those overcoming health setbacks have ~53% frequently choosing instant meals, signaling the potential for nutritious quick bites.
Hobby Enthusiasts' Swift Satisfactions: With ~53% diving into instant choices either daily or multiple times weekly, it's clear they want more time for passions, and less for meal prep.
Breadwinners' Swift Bites: 14.4% dine on instant meals daily. Busy lives, swift solutions; they're embracing instant foods at a 49.2% rate multiple times weekly.
Family Starters' Diverse Tastes: Highest in daily indulgence at 17.2%, yet also showcasing a 17.2% monthly preference, painting a broad spectrum of food habits.
Takeaway: As Fall 2023 unfolds, our lifestyle narratives are undeniably influencing our food choices. CPG leaders, here's your golden ticket: aligning products with these distinct life chapters can be the next big move!
"Generational Journeys": Unmasking Life's Diverse Pursuits Through the Ages!
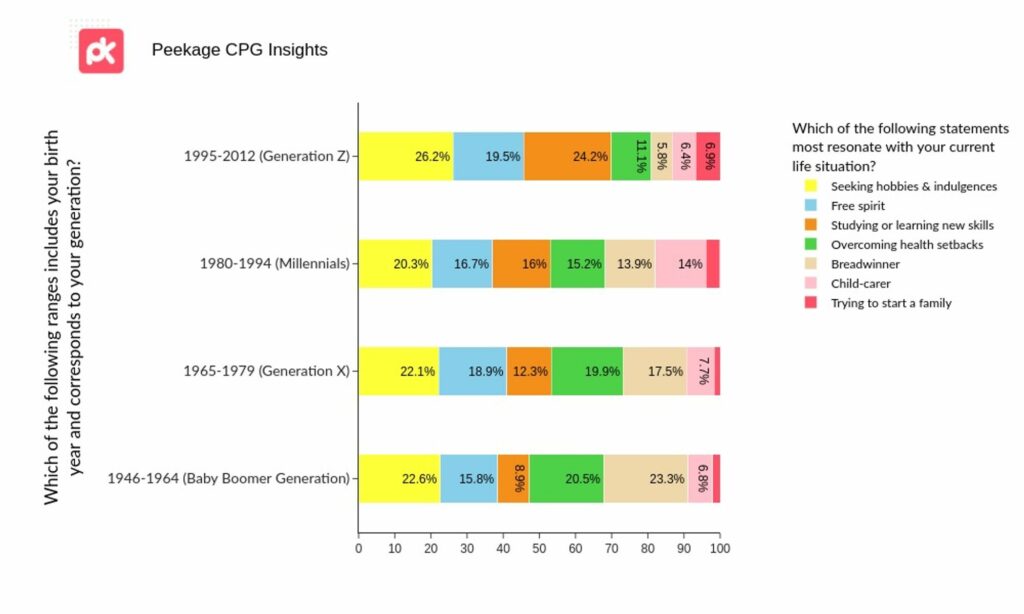
Generation Z (1995-2012):
- Skill-Seekers Supreme: A whopping ~24% are immersed in learning and evolving.
- The Great Escape: A dominant 26% relish in hobbies and indulgences, showcasing their diverse interests.
- Gen Z Freedom Flyers: ~20% embody the essence of a "free spirit", embracing life with open arms.
Millennials (1980-1994):
- Hobbyist Haven: Leading the pack with ~20% diving into hobbies & personal indulgences.
- Millennial Moods: Equally strong sentiments for "Free Spirit" (~17%), and "Studying or Learning New Skills" (~16%).
- Family & Future: ~14% are the primary earners, while ~14.0% take on the role of child-carers.
Generation X (1965-1979):
- Seek, Indulge, Thrive: ~22% relish in pursuing hobbies and personal passions.
- Freedom at Heart: A spirited ~19% cherish their "free spirit" stance in life.
- Health & Hustle: ~20% navigate health setbacks while juggling their various roles.
Baby Boomers (1946-1964):
- Breadwinning with Pride: A surprising ~23% still lead the charge in providing for their families.
- The Age of Indulgence: ~23% actively dive into hobbies, seeking fresh experiences and memories.
- Health's Hurdles: A significant ~21% are focused on overcoming health-related challenges.
Generational Gourmet: The Age-Group Appetite for Grab & Go in 2023 Revealed!
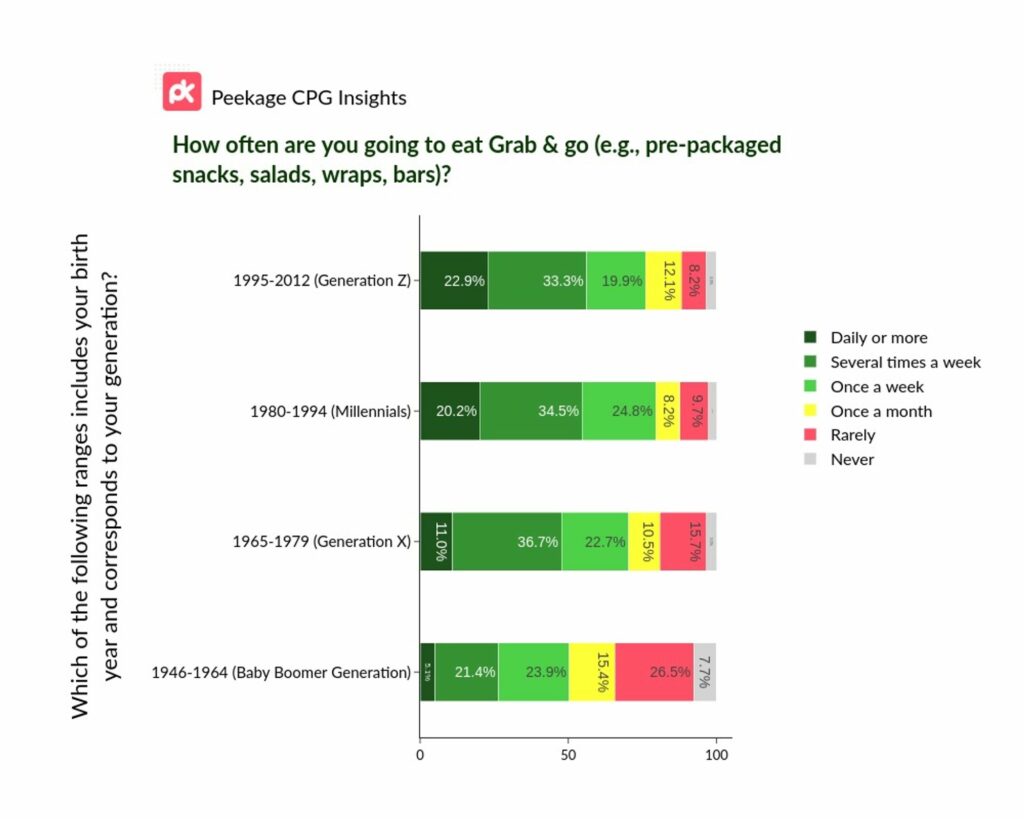
Gen Z in the Fast Lane: Leading the pack, ~23% munch on the move daily, indicating their fast-paced, on-the-go lifestyle demands rapid food solutions.
Millennials' Quick Munches: A whopping ~20% savor grab & go delights daily! Couple that with the ~35% reaching for quick bites several times weekly, we see a staggering ~55% leaning on convenience nearly every other day.
Gen X Stays Nimble: ~37% opt for grab & go solutions several times a week, showing that between juggling responsibilities and seeking relaxation, snappy meals fit just right.
Baby Boomers' Considered Choices: While ~24% indulge in grab & go weekly, a notable ~27% showcase a preference for rare consumption, possibly echoing an era of home-cooked values.
"Meat the Generations!": Processed Meats' Sizzling Demand Across Ages!
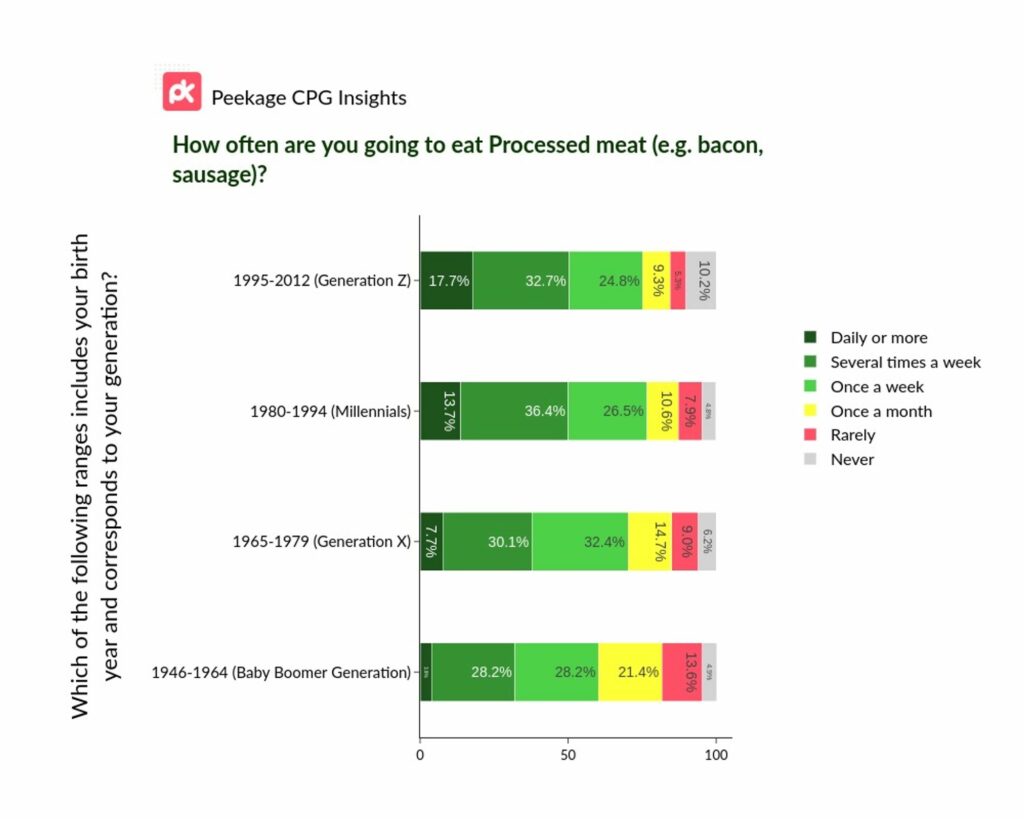
Gen Z's Bold Choices: Leading with a zestful ~18% munching daily, there's a twist as 10.2% consciously choose to abstain completely. A generation of contrasts!
Millennials' Meaty Moments: A robust ~14% indulge in processed meats daily, with a significant ~36% diving in several times a week – signifying their love for the sizzle!
Gen X's Balanced Bite: While ~32% enjoy that bacon strip or sausage once a week, 30.1% choose several times a week, revealing a hearty appetite for processed delights.
Baby Boomers' Deliberate Delicacies: While their weekly consumption (~28%) stays steady, a more occasional palate is evident with ~21% indulging just once a month.
Takeaway: As the leaves turn this fall, one thing stands clear: each generation brings its own flavor to the table. CPG leaders, understanding these generational trends can be your key to unlocking untapped markets!


